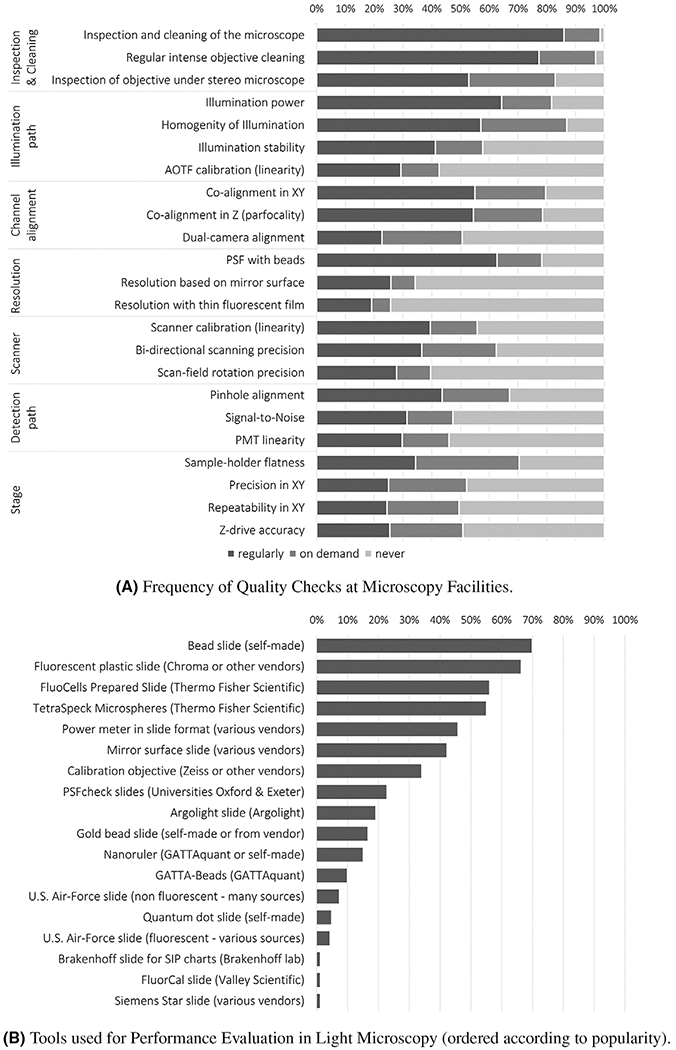
FIGURE 2.

Frequency and type of tests performed in core facilities
Note: Prior to a session on QC organized during the Microscopy Facility Day at the 2019 ELMI meeting, light microscopy core facility representatives around the globe were asked to complete a survey about the type and the frequency of tests performed in their facility. The link to the survey was opened in June 2019, 2 weeks before the meeting, and sent to all registered participants. It was also advertized multiple times on various international microscopy forums. Reminders were also sent to participants after the meeting and responses were subsequently collected until February 2020. The histograms in panels (A) and (B) summarize the responses from almost 200 facilities in a simplified manner. Panel (A) displays how often different quality checks are performed; the x-axis represents in percentage the respective frequency categories, namely, regularly, on demand and never. Panel (B) highlights which tools are used for performance evaluation of light microscopes; the x-axis represents the percentage of respondents using the indicated QC tool.
