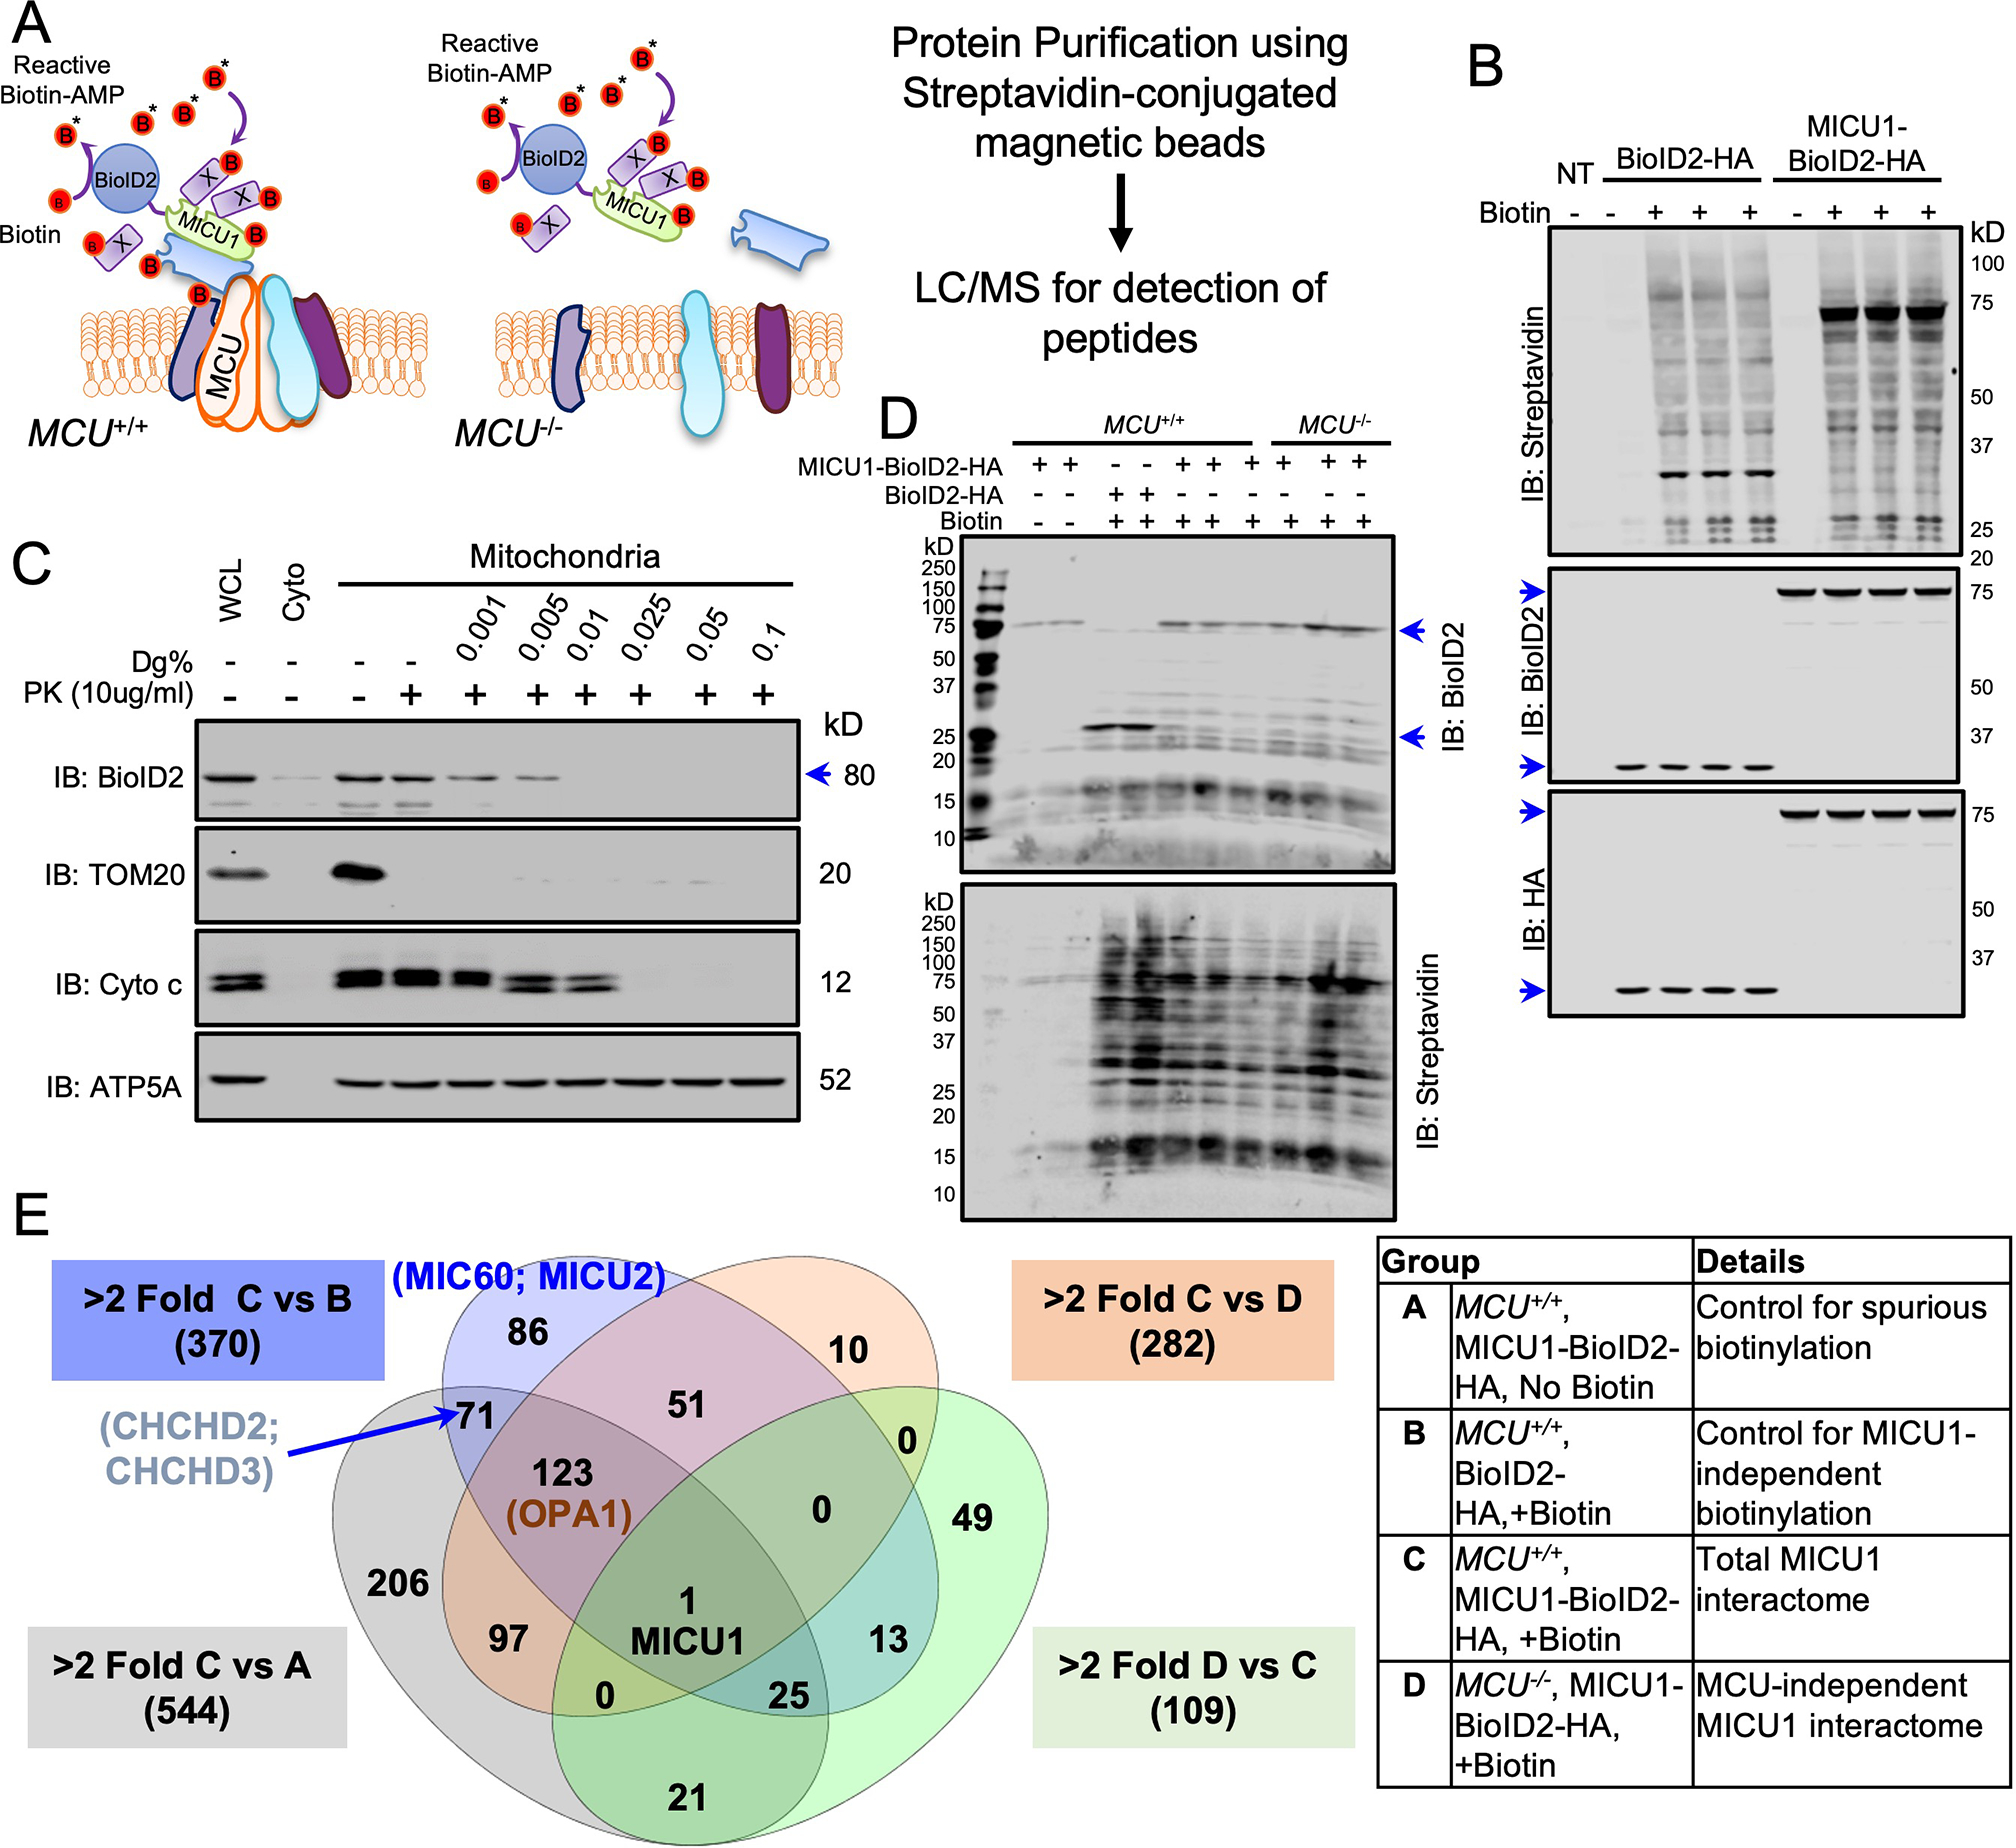
Fig. 2. Identification of mtCU-independent MICU1 interactors.

(A) Experimental scheme for identifying mtCU-independent binding partners for MICU1 by biotin-based proximity labeling using the MICU1-BioID2-HA fusion protein. (B) MICU1−/− HEK293T cells expressing BioID2-HA or MICU1-BioID2-HA were cultured with biotin (50μM) for 16h and lysates were Western blotted with the indicated antibodies. n= 2 independent experiments. (C) Mitochondrial fractions from MICU1−/− HEK293T cells reconstituted with MICU1-BioID2-HA were subjected to increasing digitonin (Dg) concentrations to permeabilize the outer mitochondrial membrane (OMM) and inner mitochondrial membrane (IMM). Proteinase K (PK) treatment was performed to cleave exposed proteins, and mitochondrial fractions were probed with the indicated antibodies. Western blots are representative of four independent experiments. (D) MCU−/− HEK293T cells expressing BioID2-HA or MICU1-BioID2-HA or not were cultured with biotin (50μM) for 16h and lysates were Western blotted for BioID2 and streptavidin. Western blots are representative of 2 independent experiments. (E) Streptavidin pull-downs from protein samples from 2–3 biological replicates per group were analyzed by LC-MS/MS. Estimated protein abundance after global sample normalization was used to compare different groups. These interactions are shown in the Venn diagram and the details of the experimental groups are given in the table.
