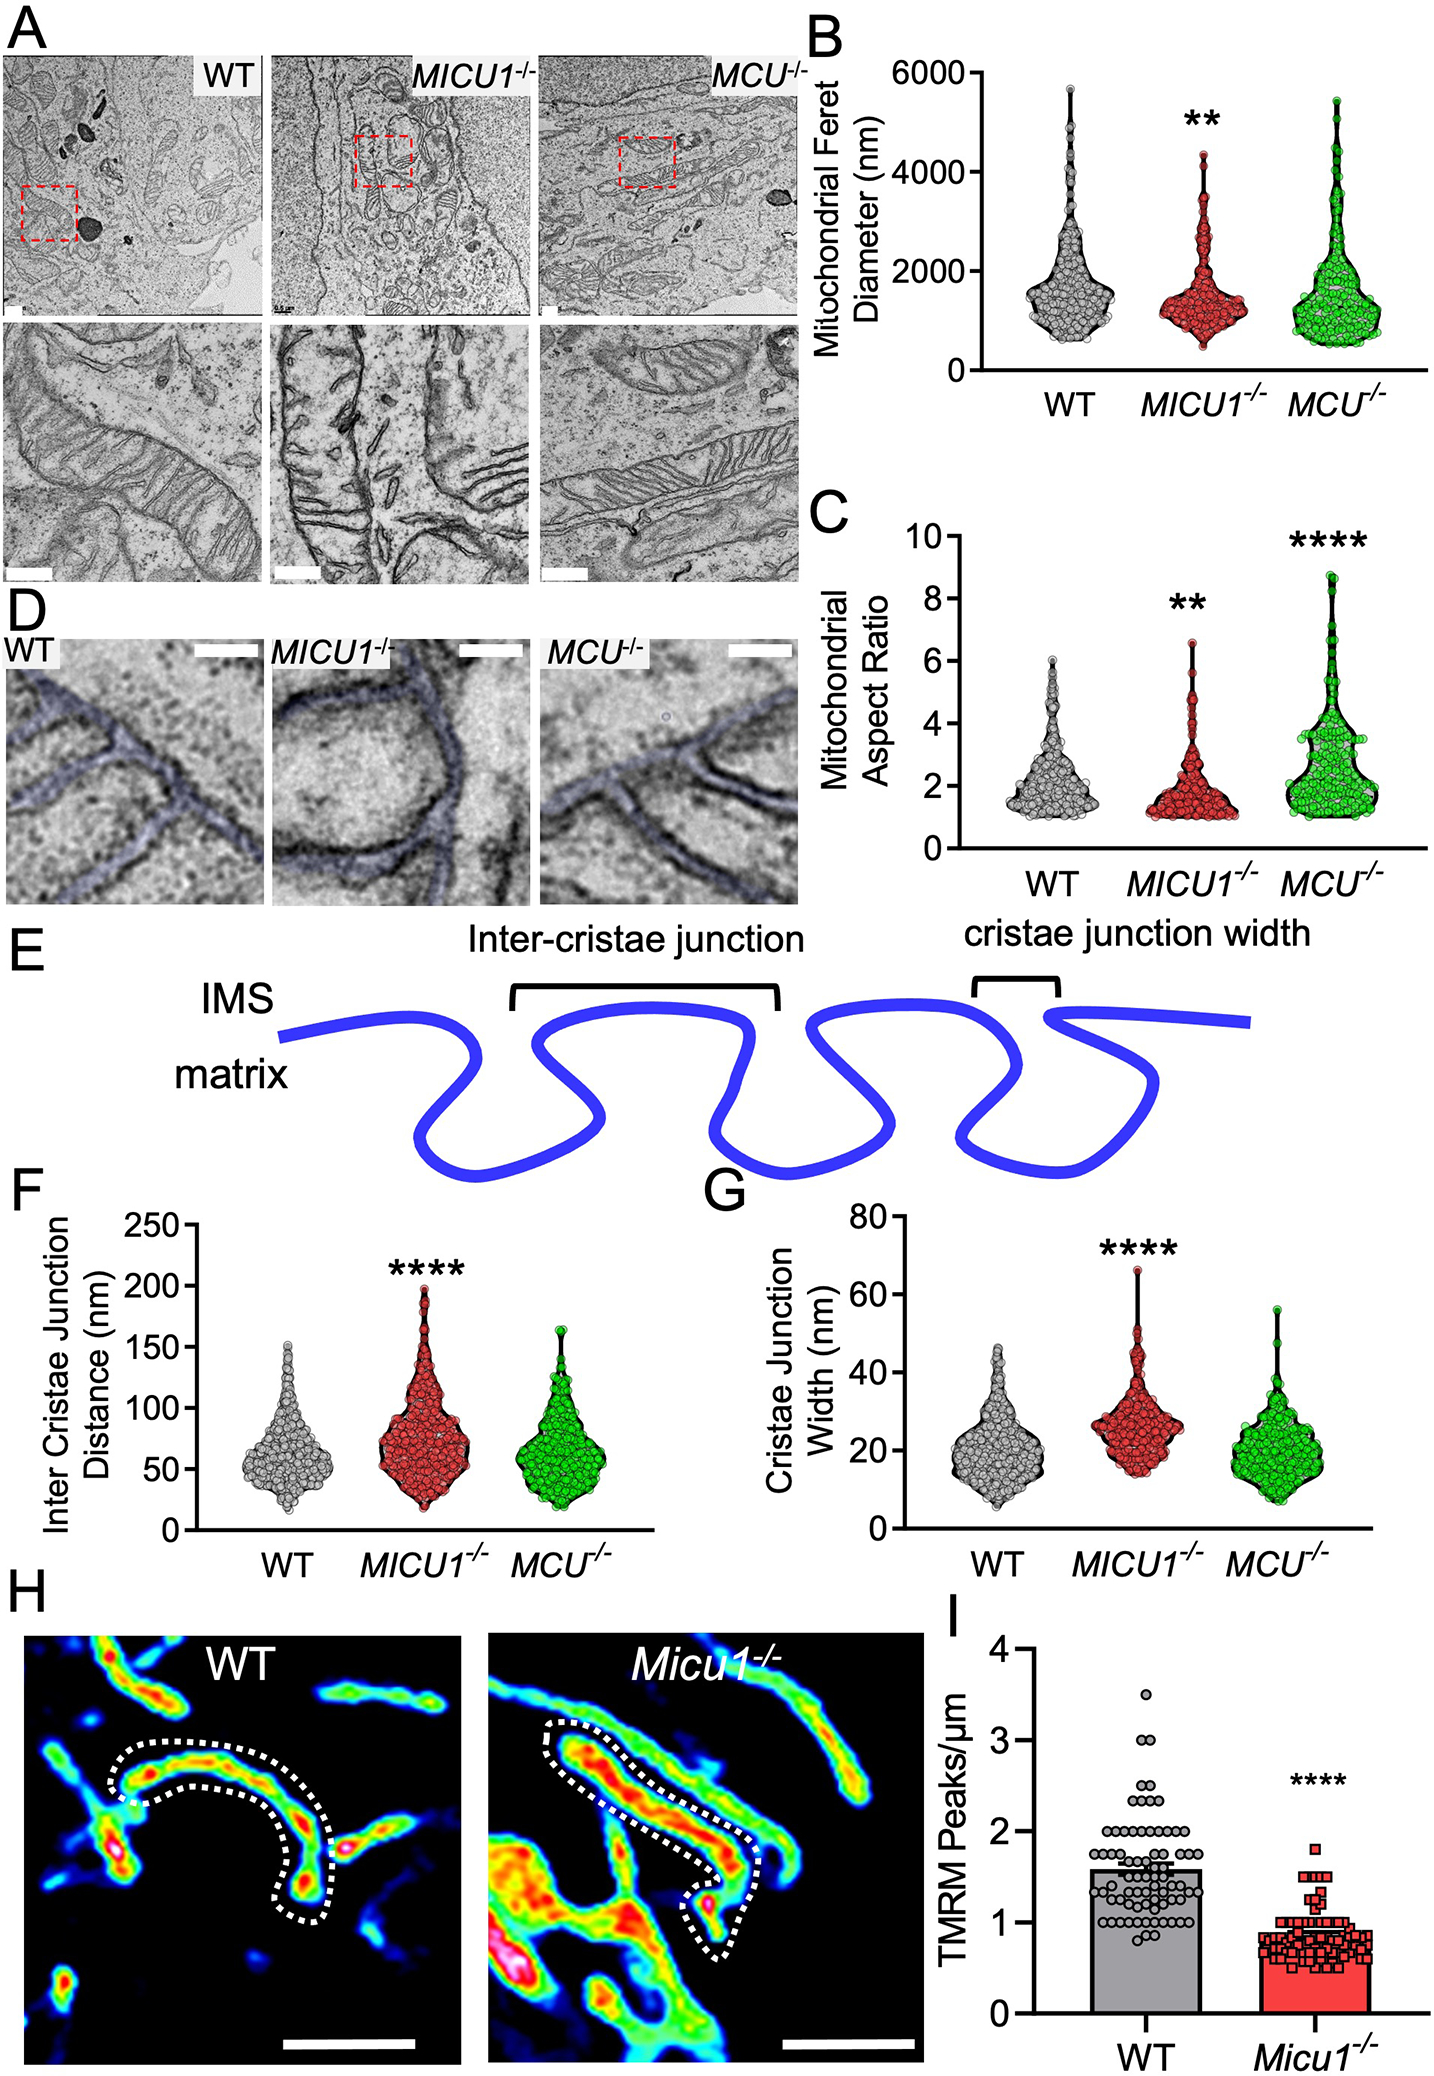
Fig. 6. MICU1−/− cells display altered cristae structure and increased cytochrome c release.

(A) WT, MICU1−/−, and MCU−/− HEK293 cells were imaged by TEM. Scale bar = 500nm. (B-C and F, G) TEM images were analyzed and quantitated using Image J Fiji. Mitochondrial feret diameter (B), aspect ratio (C), inter-cristae junction distance (F), and cristae junction width (G) were plotted. Statistical significance was determined using Welch’s t-test. ****, p<0.0001; **, p<0.01. n=200–300 mitochondria from 50 images acquired from n= 2 independent biological replicates per group. (D) Cristae ultrastructure in WT, MICU1−/−, and MCU−/− HEK293 cells imaged by TEM. Scale bar = 50nm. (E) Schematic depiction for the cristae junction width and inter-cristae junction distance. (H) ΔΨm distribution along the mitochondrial filaments in WT and Micu1−/− MEFs loaded with TMRM. Scale bar = 2μm. Images are representative of 3 independent experiments. (I) Mitochondrial filaments were quantified for the ΔΨm distribution (TMRM peaks/μm). Statistical significance was determined using Welch’s t-test. ****, p<0.0001. n=70–75 mitochondria from 2 independent experiments.
