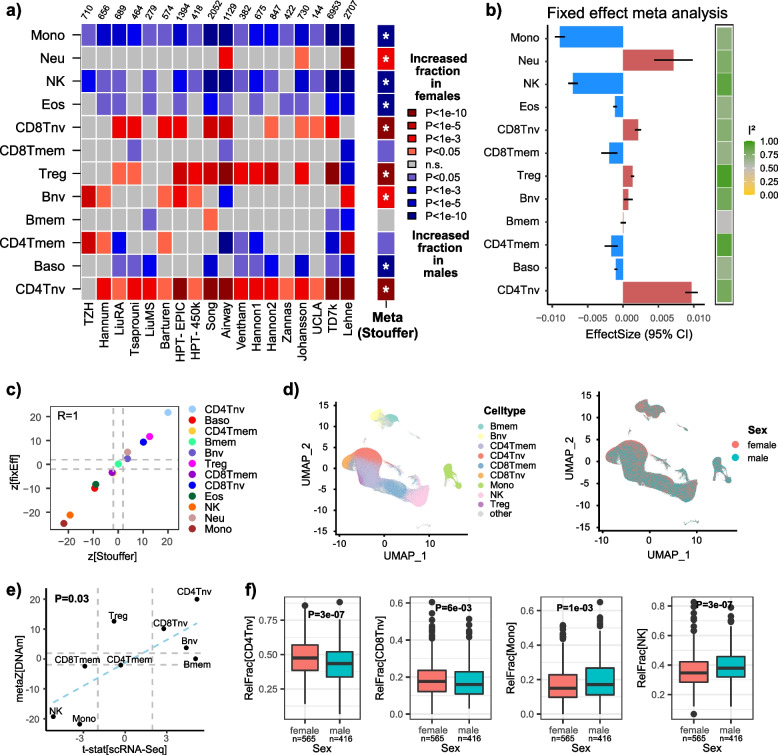
Fig. 4.
Association and validation of immune-cell fractions with sex. a Heatmap of associations between blood cell-type fractions and sex in each of 18 cohorts with sex information. Cohort sizes are shown above heatmap. Red (blue) tones indicate fractions that increase in females (males). P-values derived from a multivariate regression that included age, smoking status, BMI (whenever available), and other study-specific confounders as described in “Methods.” Meta(Stouffer) indicates the directional Stouffer meta-analysis z-statistic and statistical significance. Associations marked with an * are significant after Bonferroni correction at 0.05 level (i.e., P < 0.05/11). b Barplot displaying the effect size estimates and 95% confidence intervals from a fixed effect inverse variance meta-analysis model. Color bar to the right labels the I2 values of heteroscedasticity. c Scatterplot of z-statistics from the directional Stouffer method, against the corresponding statistics from the fixed effect meta-analysis model. R-value of agreement is shown. Gray dashed lines indicate the line P = 0.05. d UMAP plots of the scRNA-Seq data of Yazar et al. profiling > 1 million PBMCs from over 900 donors encompassing both sexes as shown. e Scatterplot of Stouffer z-statistics for each cell type derived from DNAm data, against the corresponding t-statistic from Propeller method based on the scRNA-Seq data. Linear regression P-value of agreement is given. f Examples of immune-cell fractions displaying significant associations with sex as inferred from scRNA-Seq data. P-values derive from Propeller

