Figure 2.
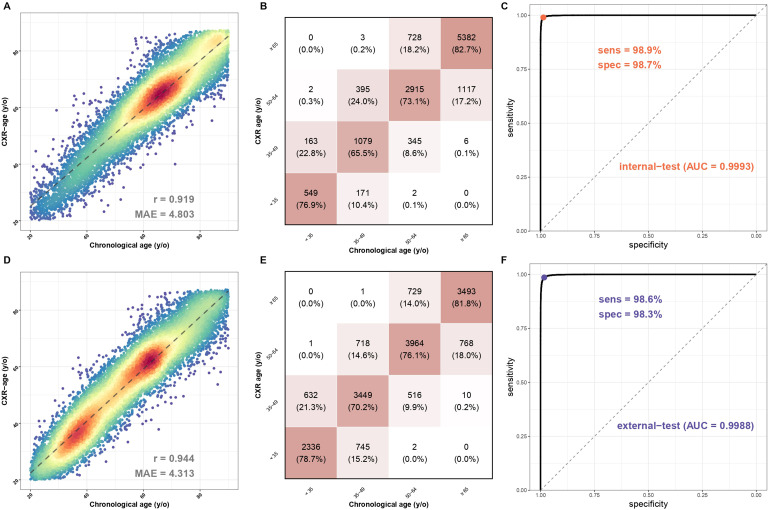
The association between chronological age and CXR age and the sensitivity and specificity of sexual prediction in the internal and external validation sets. (A) Scatter plots of chronologic age and CXR age in the internal validation set. Red points represent the highest density, followed by yellow, green light blue, and dark blue. Perfect model performance would fall only along the diagonal line. (B) The confusion matrix in the internal validation set categorized by 15 years old. The squared weighted kappa value was 0.76 in this analysis. (C) AUC curve of sexual prediction in the internal validation set. (D) Scatter plots of chronologic age and CXR age in the external validation set. Red points represent the highest density, followed by yellow, green light blue, and dark blue. Perfect model performance would fall only along the diagonal line. (E) The confusion matrix in the external validation set categorized by 15 years old. The squared weighted kappa value was 0.76 in this analysis. (F) AUC curve of sexual prediction in the external validation set. AUC: area under curve; CXR: chest X-ray.

