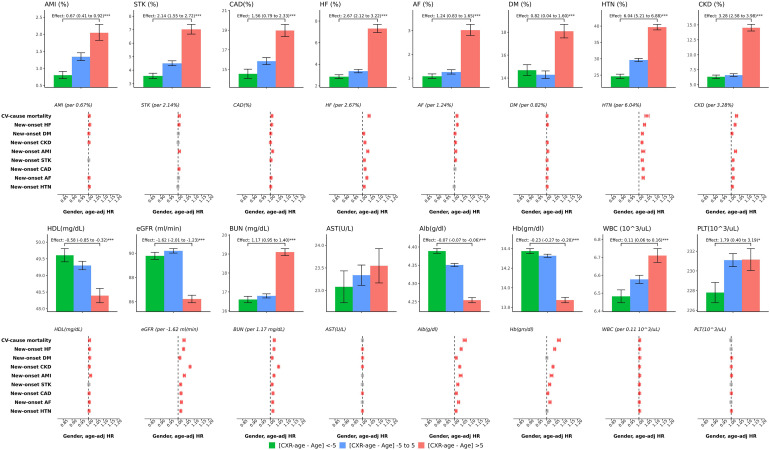
Figure 3.
Analysis of the characteristics and risk contributions in patients with inconsistent chronological age and CXR age in the validation set. We selected patient characteristics for risk analysis based on the outcome of interest. Bar plots represent the mean or proportion where appropriate and corresponding 95% conference intervals, which are adjusted by gender and chronological age via linear or logistic regression, based on patient characteristics in patients with lower to higher residuals. (CXR age—chronological age) Significant tests are based on the trend test (*: p for trend < 0.05; **: p for trend < 0.01; ***: p for trend < 0.001), and the effects were the difference per group. Risk analysis plots showed the hazard ratios, calculated by the change in values among each residual group. The colors red, gray, and blue represent positive, nonsignificant, and negative impacts on the corresponding outcomes, respectively. CXR: chest X-ray.

