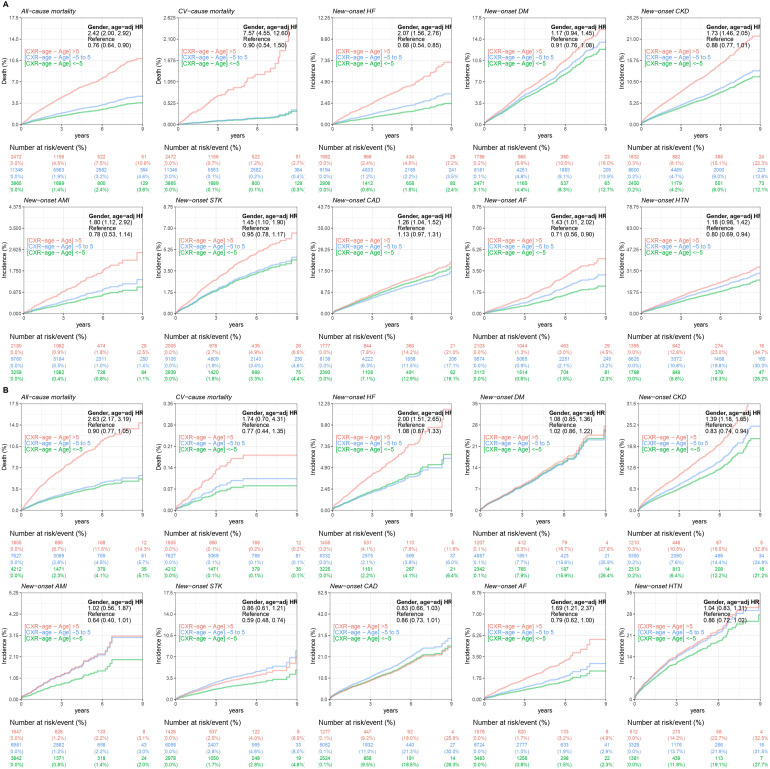
Figure 4.
The comparison of positive, near zero, and negative inconsistent chronological age and CXR age for long-term outcomes of interest in each validation set. These line charts were compared with three lines, red, blue, and green, representing CXR ages >5, between 5 and −5, and <5, respectively, to show the difference in long-term incidence and adverse events in each group. The number of patients in the risk plot is shown under each line chart for assistance. (A) Analysis of the internal validation set. (B) Analysis of the external validation set. CXR: chest X-ray.

