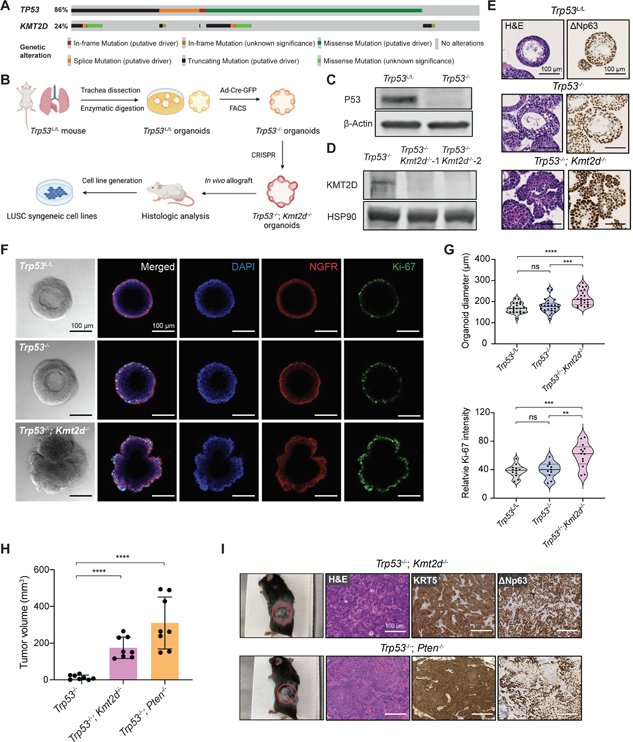
Figure 1. Kmt2d deletion promotes lung organoids transformation.
(A) OncoPrint showing frequency of KMT2D mutations and their co-occurrence with TP53 mutations in human LUSC database (TCGA, PanCancer Atlas, n=469).
(B) Schematic illustration of the workflow for establishing mutant organoids and syngeneic cell lines from parental Trp53L/L lung basal cell organoids.
(C) Western blot confirmation of P53 loss in the Trp53−/− organoids, with β-Actin as the loading control.
(D) Western blot confirmation of KMT2D loss in the Trp53−/−; Kmt2d−/− organoids, with HSP90 as the loading control.
(E) Representative images of hematoxylin and eosin (H&E) staining, and immunohistochemistry (IHC) staining of ΔNp63 in organoids with indicated genotypes. Scale bars, 100 μm.
(F) Representative images from brightfield microscopy and immunofluorescence staining of organoids after 7 days of culture. Organoids were stained with DAPI (blue), NGFR (red) and Ki-67 (green). Scale bars, 100 μm.
(G) Violin plots showing quantifications of the diameter and relative Ki-67 intensity in organoids with indicated genotypes. **p < 0.01, ***p < 0.001, ****p < 0.0001, NS, not significant (unpaired two-tailed t test).
(H) Quantifications of tumor volumes 6 weeks after implanting organoids into C57BL/6J mice. Data shown as means ± SEM. ****p < 0.0001 (unpaired two-tailed t test).
(I) (Left) Representative images of subcutaneous tumors from implanted organoids with indicated genotypes. The red circles indicate the tumors. (Right) Representative images of H&E staining and IHC staining of KRT5 and ΔNp63 in tumors derived from Trp53−/−; Kmt2d−/− and Trp53−/−; Pten−/− organoids. Scale bars, 100 μm.
See also Figures S1 and S2.

