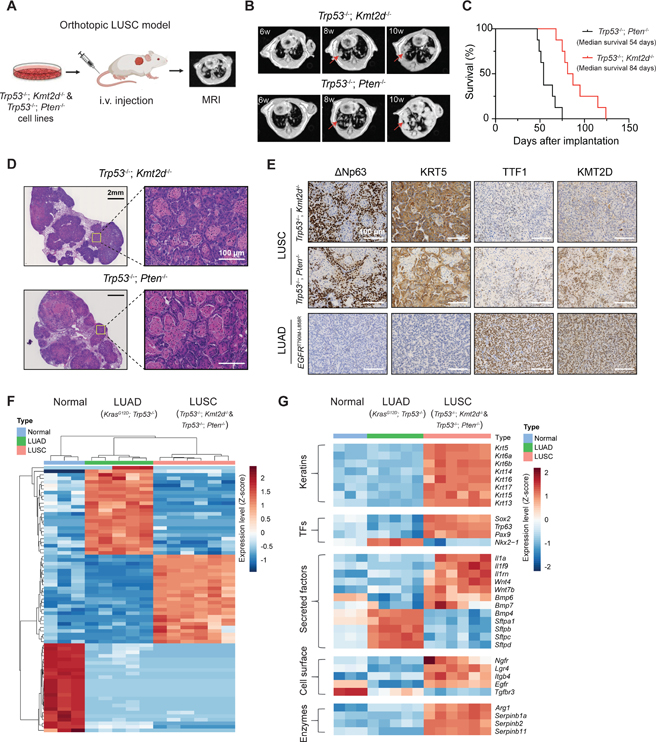
Figure 2. Kmt2d deletion drives LUSC in vivo.
(A) Schematic illustration for the orthotopic LUSC model from tumor-derived syngeneic cells. Tumor growth was monitored by magnetic resonance imaging (MRI).
(B) Representative mouse lung MRI images at indicated times after injecting cells with indicated genotypes. The red arrows indicate lung tumors.
(C) Kaplan-Meier curves of tumor bearing mice with the indicated genotypes. (n = 8 for Trp53−/−; Kmt2d−/− and n = 8 for Trp53−/−; Pten−/−).
(D) H&E staining of Trp53−/−; Kmt2d−/− and Trp53−/−; Pten−/− lung tumors showing squamous carcinoma histology.
(E) Representative images of IHC staining of ΔNp63, KRT5, TTF1, and KMT2D from lung tumors with the indicated genotypes. Scale bars, 100 μm.
(F) Heatmap and hierarchical clustering of differentially expressed transcripts from normal mouse lung tissues, LUAD (KrasG12D; Trp53−/−) and LUSC (Trp53−/−; Kmt2d−/− and Trp53-/−; Pten−/−).
(G) Heatmap showing LUSC and LUAD marker gene expression in normal mouse lung tissues, LUAD (KrasG12D; Trp53−/−) and LUSC (Trp53−/−; Kmt2d−/− and Trp53−/−; Pten−/−). Genes shown were in “Keratins”, “Transcription factors (or TFs)”, “Secreted factors”, “Cell surface” and “Enzymes” categories.
See also Figure S3.

