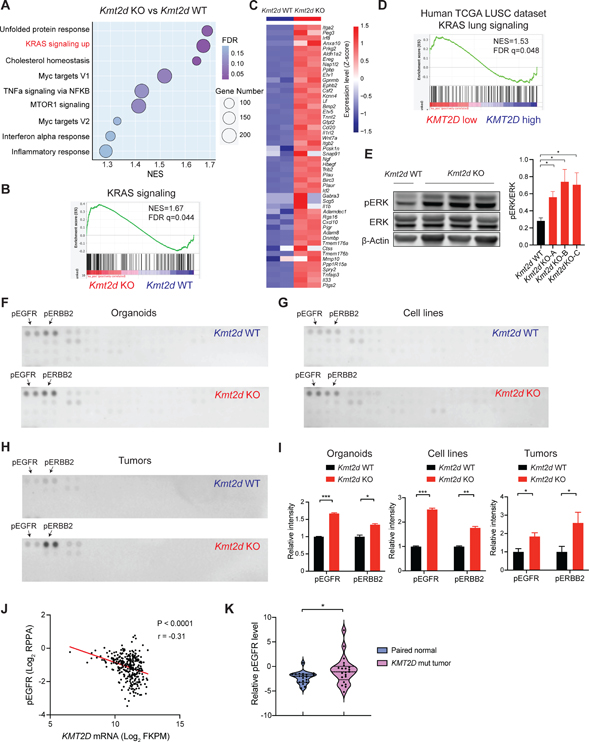
Figure 3. Kmt2d deletion activates RTK-RAS signaling in LUSC.
(A) Dot plots showing positively enriched pathways (NOM P < 0.05 and FDR q < 0.25) in Gene Set Enrichment Analysis (GSEA) comparing Kmt2d KO (Trp53−/−; Kmt2d−/−) versus the Kmt2d WT (Trp53−/−; Pten−/−) tumor-derived cell lines. “KRAS signaling up” ranks the second among positively enriched pathways.
(B) GSEA analysis showing the significantly enriched KRAS signaling from Figure 3A.
(C) Heatmap showing genes that were significantly upregulated (Log2FC >1) in the “KRAS signaling up” gene set from Figure 3B.
(D) GSEA analysis showing the significantly enriched KRAS signaling pathway comparing KMT2D low versus KMT2D high LUSC tumors (TCGA LUSC dataset).
(E) Western blot showing ERK, pERK and β-Actin in Kmt2d KO (Trp53−/−; Kmt2d−/−) and Kmt2d WT (Trp53−/−; Pten−/−) cells and quantifications of pERK/ERK. Data shown as means ± SEM. *p < 0.05 (unpaired two-tailed t test).
(F-H) Phospho-receptor tyrosine kinase arrays for Kmt2d KO and Kmt2d WT organoids (F, Trp53−/− vs Trp53−/−; Kmt2d−/−), cell lines (G, Trp53−/−; Pten−/− vs Trp53−/−; Kmt2d−/−) and tumor nodules (H, Trp53−/−; Pten−/− vs Trp53−/−; Kmt2d−/−). pEGFR and pERBB2 are highlighted by the arrows.
(I) Quantifications of pEGFR and pERBB2 in Kmt2d KO and the Kmt2d WT organoids, cell lines and tumor nodules as indicated above. Data shown as means ± SEM. *p < 0.05, **p < 0.01, ***p < 0.001 (unpaired two-tailed t test).
(J) Scatter plots showing a negative correlation between KMT2D mRNA level and phospho-EGFR expression in human TCGA LUSC dataset. r, Pearson’s correlation coefficient.
(K) Violin plots showing the relative phospho-EGFR protein expression in KMT2D mutant LUSC tumors and their paired normal lung tissues from Satpathy et al.37 *p < 0.05 (unpaired two-tailed t test).
See also Figure S3.

