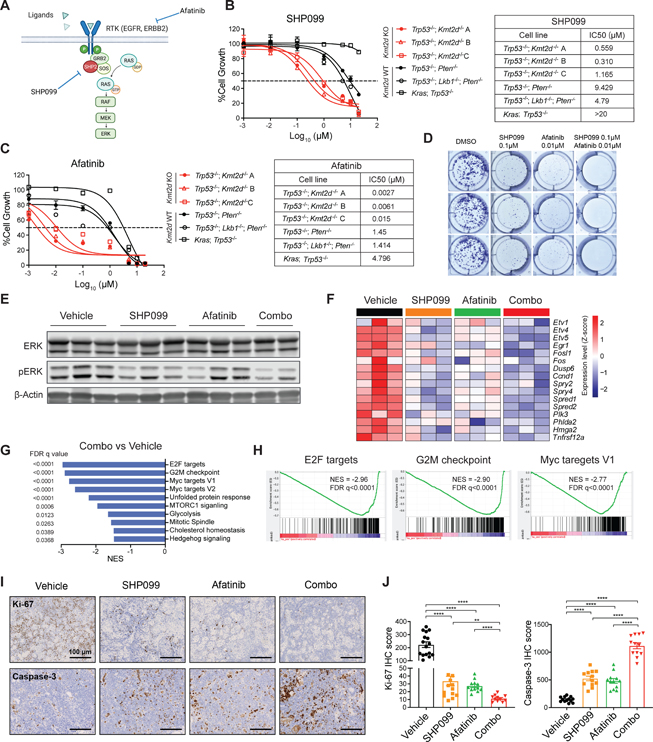
Figure 4. Kmt2d-deficient LUSC is hypersensitive to SHP2 and pan-ERBB inhibition.
(A) Schematic illustration of targeting RTK-RAS signaling through SHP2 inhibitor SHP099 and pan-ERBB inhibitor afatinib.
(B and C) Cell viability assays of Kmt2d KO LUSC cell lines, Kmt2d WT LUSC cell lines, and LUAD (KP) cell line treated with SHP099 (B) and afatinib (C) for 72h. Data presented as mean ± SD (n = 3). The calculated IC50 values of SHP099 and afatinib are shown on the right.
(D) Colony formation assay of Kmt2d KO cells treated with vehicle, SHP099, afatinib, and combination of SHP099 and afatinib for 7 days.
(E) Western blot of ERK, pERK and β-Actin on Kmt2d KO (Trp53−/−; Kmt2d−/−) tumors treated with vehicle, SHP099, afatinib and combination of SHP099 and afatinib for 3 days.
(F) Heatmap showing the changes in KRAS signaling downstream gene expression by RNA-seq in Kmt2d KO tumors treated as indicated in Figure 4E.
(G) Plots showing top negatively enriched pathways in GSEA comparing combination of SHP099 and afatinib (combo) treated versus vehicle treated Kmt2d KO tumors.
(H) GSEA analysis showing top negatively enriched pathways “E2F targets”, “G2M checkpoint” and “Myc targets V1” comparing combo treated tumors versus the vehicle treated tumors.
(I) IHC analysis of Ki-67 and cleaved caspase-3 from Kmt2d KO tumors with indicated treatment. Scale bars, 100 μm.
(J) Quantifications of IHC score of Ki-67 and cleaved caspase-3 of indicated treatment. Data shown as means ± SEM. **p < 0.01, ****p < 0.0001 (unpaired two-tailed t test).
See also Figure S4.

