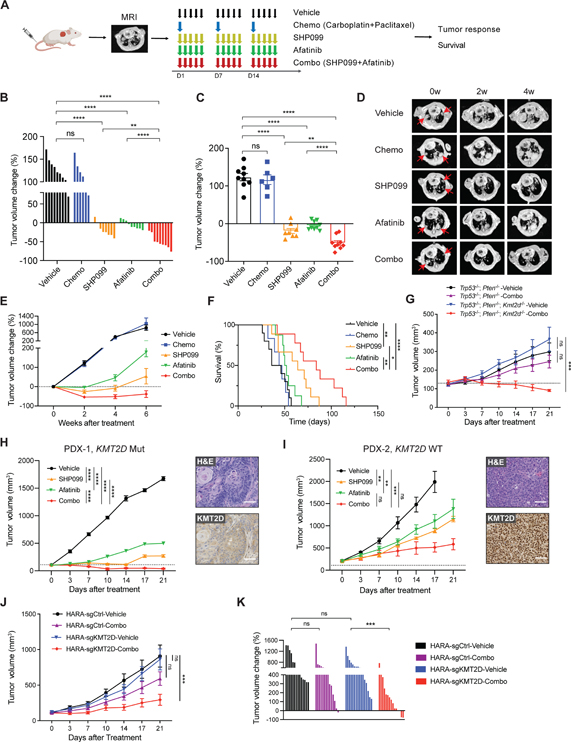
Figure 5. SHP099 and afatinib diminish KMT2D-deficient LUSC in vivo.
(A) Schematic showing in vivo dosing schedule. After inoculating LUSC cells into mice, lung tumor burden was confirmed by MRI. Mice were then randomized and treated with vehicle, chemotherapy (chemo, carboplatin + paclitaxel), SHP099 (75mpk, 5 days per week), afatinib (10mpk, 5 days per week) alone or combined SHP099 with afatinib. Tumor growth was measured by MRI and survival was recorded.
(B and C) Waterfall plot (B) and dot plot (C) of changes in tumor volumes after 2 weeks of treatment in Kmt2d KO (Trp53−/−; Kmt2d−/−) LUSC model: vehicle (n=9), chemo (n=6), SHP099 (n=8), afatinib (n=9), and combo (n=9).
(D) Representative MRI images of Kmt2d KO lung tumor at baseline (0 week), 2 weeks, and 4 weeks after treatment initiation. The red arrows indicate lung tumors.
(E) Tumor volume changes of Kmt2d KO LUSC tumors treated as indicated in Figure 5A.
(F) Kaplan-Meier survival curve for the Kmt2d KO LUSC model after indicated treatment. Vehicle (n=9), chemo (n=6), SHP099 (n=9), afatinib (n=8), and combo (n=9). *p < 0.05, **p < 0.01, ****p < 0.0001 (log-rank test).
(G) Tumor volume changes of Trp53−/−; Pten−/− (n=7–8) and Trp53−/−; Pten−/−; Kmt2d−/− (n=6–8) allografts with indicated treatment.
(H) Tumor volume changes of KMT2D mutant LUSC PDX (PDX-1, LX-515) following treatments with vehicle (n=4), SHP099 (n=5), afatinib (n=3) and combined SHP099 with afatinib (n=7). Representative images of H&E and IHC staining of KMT2D are shown. Scale bars, 100 μm.
(I) Tumor volume changes of KMT2D WT LUSC PDX (PDX-2, LX-640) following treatments with vehicle (n=6), SHP099 (n=4), afatinib (n=5) and combined SHP099 with afatinib (n=6). Representative images of H&E and IHC staining of KMT2D are shown. Scale bars, 100 μm.
(J) Tumor volume changes of human HARA-sgCtrl xenografts following treatments with vehicle (n=14), and combined SHP099 with afatinib (n=14), as well as HARA-sgKMT2D xenografts following treatments with vehicle (n=16), and combined SHP099 with afatinib (n=15).
(K) Waterfall plot showing changes in tumor volumes after 3 weeks of treatment (as indicated in Figure 5J) in HARA-sgCtrl and HARA-sgKMT2D LUSC models.
In (B), (C) and (K), data shown as means ± SEM, **p < 0.01, ***p < 0.001 ****p < 0.0001, NS, not significant (unpaired two-tailed t test). In (G), (H), (I) and (J), data shown as means ± SEM, **p < 0.01, ***p < 0.001, ****p < 0.0001, NS, not significant (ANOVA).
See also Figure S5.

