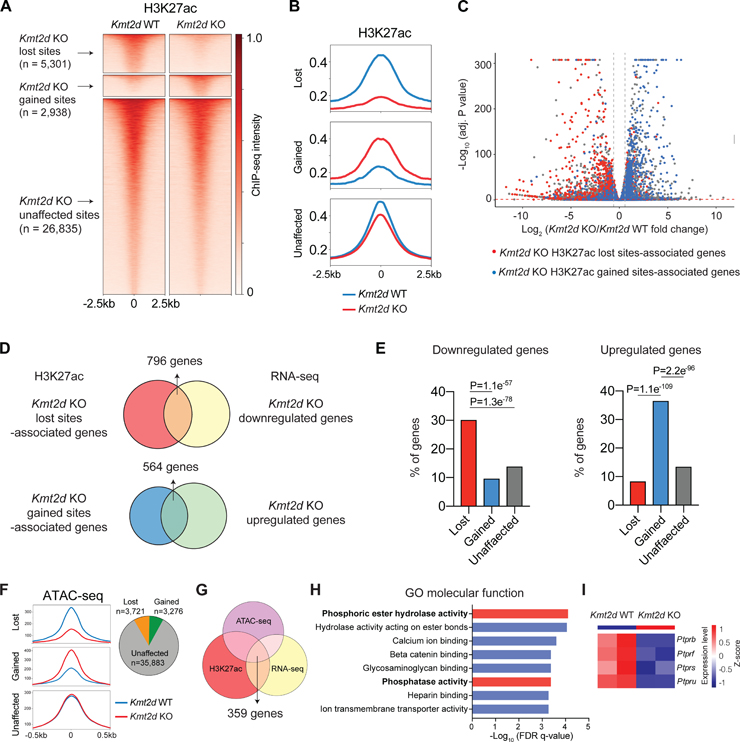
Figure 6. Kmt2d loss reprograms epigenetic landscape in LUSC.
(A) Heatmaps showing the H3K27ac ChIP-seq signal in Kmt2d WT (Trp53−/−; Pten−/−) and Kmt2d KO (Trp53−/−; Kmt2d−/−) cell lines. Based on the ChIP-seq signal changes, H3K27ac sites were categorized into three groups: Kmt2d KO -lost, -gained and -unaffected.
(B) Averaged H3K27ac ChIP-seq signal, centered at the Kmt2d KO-lost, -gained, and -unaffected H3K27ac sites.
(C) RNA-seq results showing downregulated (left upper corner) and upregulated (right upper corner) genes in Kmt2d KO cell lines (FDR<0.05; Fold Change>1.5). Genes that were associated with lost and gained H3K27ac sites (genes with the closest distances to the sites) are highlighted by red and blue, respectively.
(D) The comparison of lost H3K27ac sites-associated genes versus RNA-seq downregulated genes in Kmt2d KO cells (up). And the comparison of gained H3K27ac sites-associated genes versus RNA-seq upregulated genes in Kmt2d KO cells (down).
(E) The percentage of genes associated with Kmt2d KO -gained, -lost and -unaffected H3K27ac sites that were downregulated (left) or upregulated (right) based on RNA-seq results.
(F) Averaged ATAC-seq signal, centered at the Kmt2d KO-lost, -gained, and -unaffected ATAC-seq sites (left). Pie graft showing number of Kmt2d KO -lost, -gained, and -unaffected ATAC-seq sites (right).
(G) Overlap of H3K27ac lost sites-associated genes, ATAC lost sites-associated genes, and RNA-seq downregulated genes in Kmt2d KO cells.
(H) Gene ontology (GO) analysis enriched pathways in “molecular function”, based on overlapped genes in (G).
(I) Heatmap of RPTPs gene expression (RNA-seq) in Kmt2d KO and Kmt2d WT cells.

