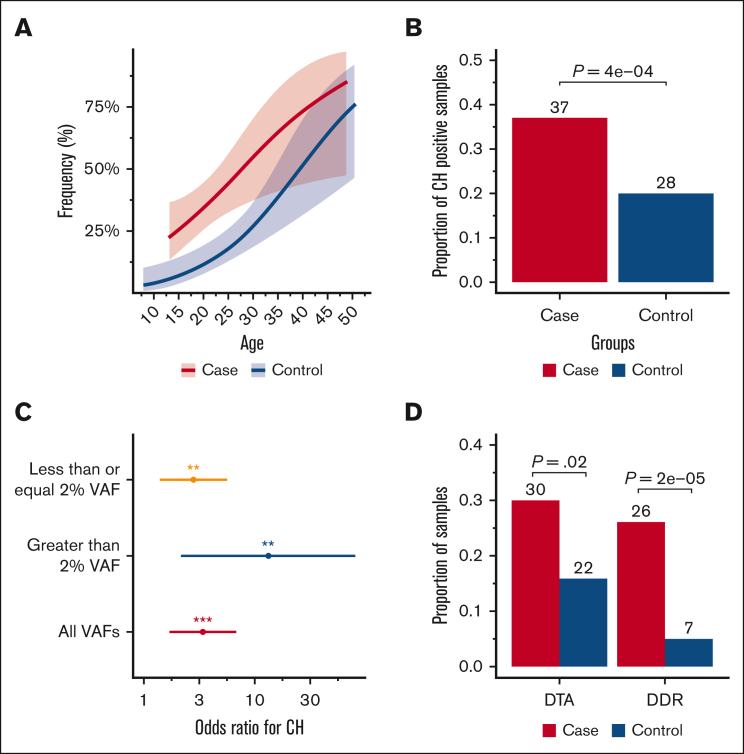
Figure 1.
Summary of CH findings in survivors of childhood, adolescent, and young adult cancer (cases), compared with controls. (A) CH frequency in survivors vs controls as a function of age; (B) prevalence of CH-positive samples in survivors vs treatment-naive controls with solid tumors; (C) odds ratio of CH on comparing cases with controls for overall CH, CH with a maximum VAF of >2%, and CH with a maximum VAF of ≤ 2%; (D) proportion of samples with DTA vs DDR in cases compared with controls. All analyses were adjusted for age, sex, and race. Fitted curves were generated using a generalized additive model. ∗P < .05; ∗∗P < .01; ∗∗∗P < .001.

