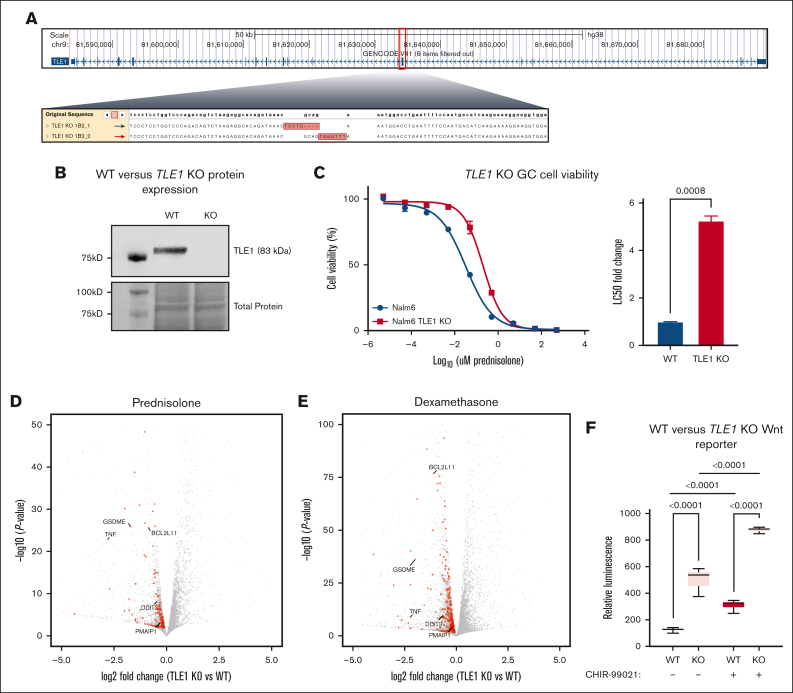
Figure 1.
Impact of TLE1 knockout on GC and canonical Wnt signaling. (A) Schematic representation of CRISPR/Cas9 genome editing of exon 7 of the TLE1 gene, with deep sequencing confirmation of the edit to both strands in Nalm6 cells. (B) Western blot showing protein expression of TLE1 (∼83 kD; Abcam ab183742) in both TLE1 KO Nalm6 and WT Nalm6 cells. Ponceau staining for total protein (bottom). (C) Prednisolone drug response curves in TLE1 KO Nalm6 cells (red) and WT Nalm6 cells (blue) after 72 hours of prednisolone treatment (left); n = 3 per group. Concentrations of prednisolone used were 5 pM, 50 pM, 0.5 nM, 5 nM, 50 nM, 0.5 μM, 5 μM, 50 μM, and 500 μM. LC50 fold-change in TLE1 KO Nalm6 cells compared with WT Nalm6 cells (right). (D-E) Volcano plots showing differentially expressed genes between WT and TLE1 KO cells after 24 hours of prednisolone (5 μM) treatment (D) or dexamethasone (100 nM) treatment (E). Genes involved in apoptotic pathways are shown in red, and several notable genes are highlighted. (F) β-Catenin luciferase reporter assay for WT Nalm6 and TLE1 KO cells treated with or without CHIR-99021 (0.5 μM) for 24 hours, n = 6 per group.

