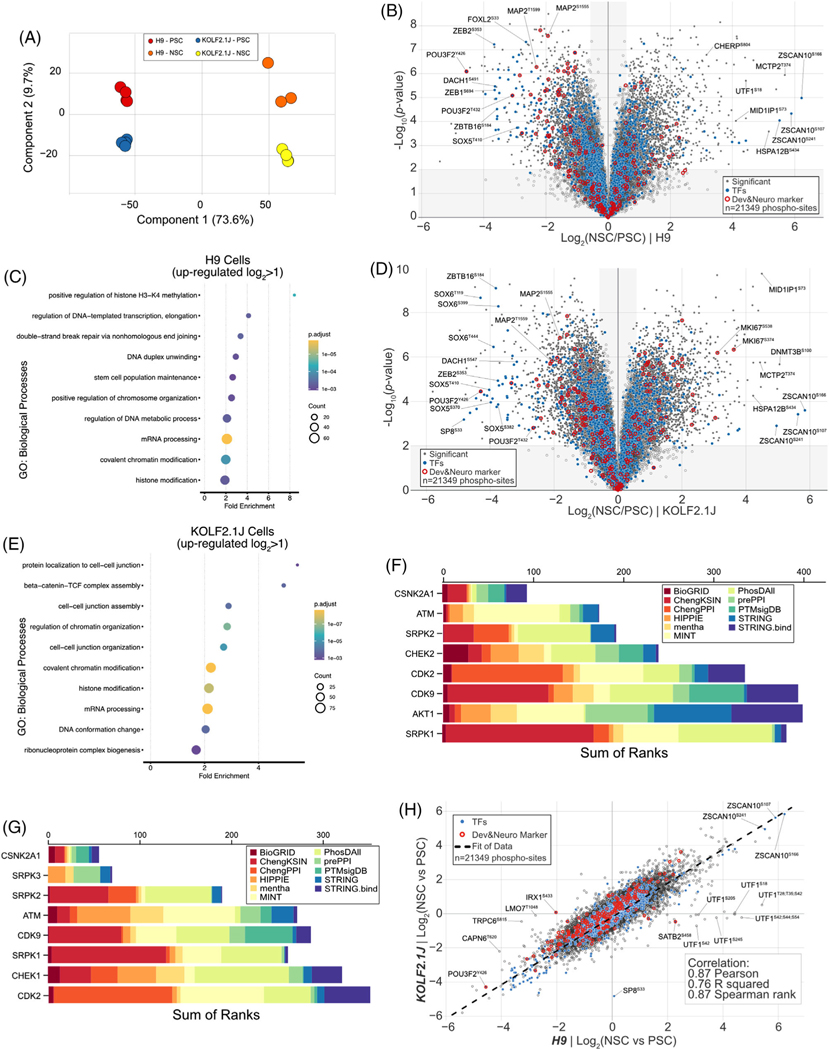
FIGURE 2.
Quantitative phosphoproteome analysis of H9 and KOLF2.1 upon neural stem cell differentiation. (A) Principal component analysis (PCA) of phospho-proteomics data obtained from 16plex TMTpro based analysis. The inset indicates color coding for individual cells (Pluripotent Stem cell (PSC), Neural Stem Cell (NSC). (B) Volcano plot shows the H9 cell line -log10-transformed p-value versus the log2-transformed ratio of Neural Stem cells/Pluripotent Stem cells for quantification. p-values were calculated by two-sided Welch’s t-test (adjusted with 1% FDR for multiple comparisons); for parameters, individual p-values and q-values, see Table S2. Individual proteins are shown in gray open circles, significantly changed protein: filled gray circle, transcription factors: filled blue circles, and developmental & neuronal markers: red open circles; 21,349 phospho-sites were quantified). (C) The enriched gene ontology (GO) terms for proteins whose abundance is significantly increased in H9 NSC compared to H9 PSC. (D) Volcano plot shows the KOLF2.1J cell line -log10-transformed p-value versus the log2-transformed ratio of neural stem cells/ pluripotent stem cells for quantification. p-values were calculated by two-sided Welch’s t-test (adjusted for multiple comparisons); for parameters, individual p-values and q-values, see Table S2. Individual proteins are shown in gray open circles, significantly changed protein: filled gray circle, transcription factors: filled blue circles, and developmental and neuronal markers: red open circles; 21349 phospho-sites were quantified). (E) The enriched gene ontology (GO) terms for proteins whose abundance is significantly increased in KOLF2.1J NSC compared to KOLF2.1J PSC. (F) MeanRank score from kinase enrichment analysis for H9 up-phosphorylated proteins in NSC to PSC comparison (Log2 > 1, p-value < 0.01). (G) MeanRank score from kinase enrichment analysis for KOLF2.1J up-phosphorylated proteins in NSC to PSC comparison (Log2 > 1, p-value < 0.01). (H) Phospho-proteome level correlation plot of log2(NSC/PSC) from KOLF2.1J cell line (y axis) or H9 cell line (x axis) upon differentiation. The calculated correlation factors (Pearson, R squared, and Spearman rank) are indicated

