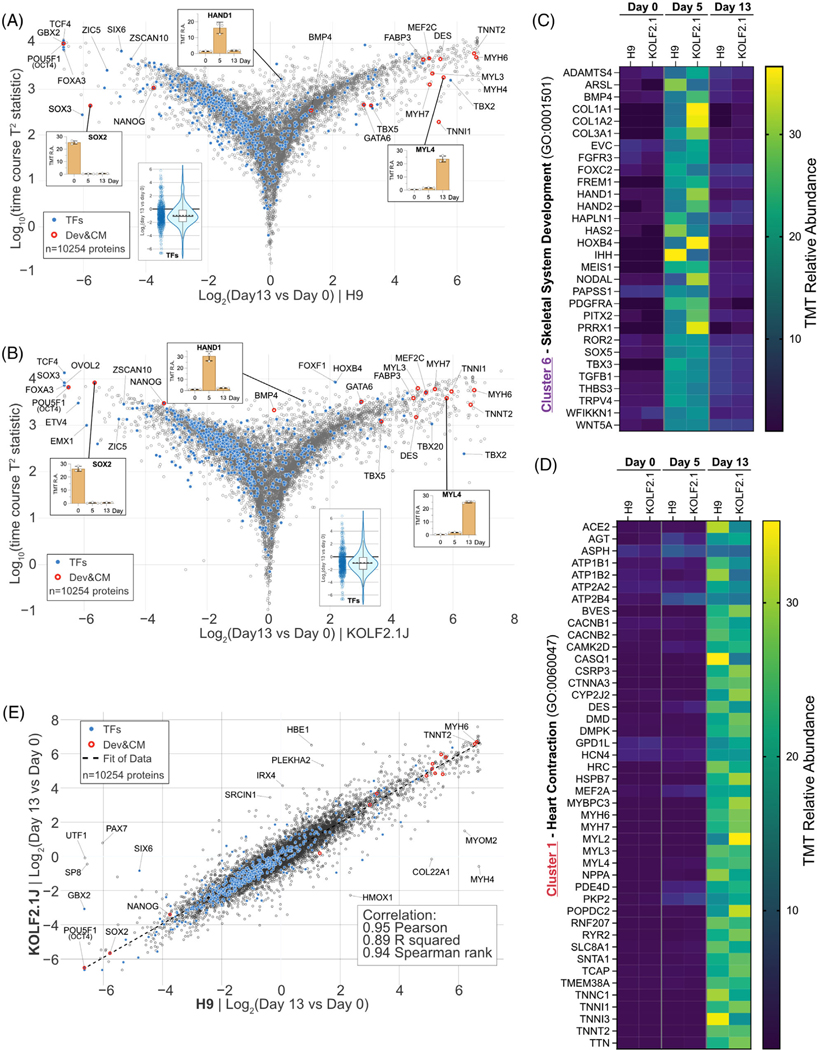
FIGURE 4.
Quantitative comparison of H9 and KOLF2.1J proteome remodeling upon cardiomyogenesis. (A) Multivariate empirical Bayes analysis of the total proteome data of H9 differentiation across the 13-day timespan. The plot displays log10((time course T2 statistics) versus log2(day 13/day 0). Individual proteins are displayed in gray open circles. Significantly changed protein: filled gray circle. Transcription factors: filled blue circles. Developmental & cardiac markers: red open circles. 10254 proteins were quantified. (B) Similar to (A) for KOLF2.1J dataset. (C) Heatmap of relative abundance with proteins in cluster 6 (CPs specific (day 5)) associated with the gene ontology term skeletal system development (GO: 0001501). (D) Heatmap of relative abundance with proteins in cluster 1 (CMs specific (day 13)) associated with the gene ontology term heart contraction (GO: 0060047). (E) Proteome level correlation plot for H9 (x axis) and KOLF2.1J (y axis) cells upon differentiation as determined by log2[ratio] in abundance comparing PSC versus CMs. The calculated correlation factors (Pearson, R squared, and Spearman rank) are indicated

