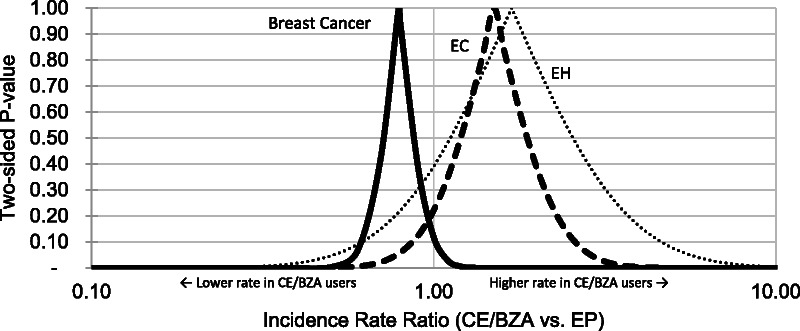
FIG. 1.

P value functions of RRs for EC, EH, and breast cancer. This plot displays all P values for a range of possible RRs. The probabilities shown are for the observed data given each hypothesized RR. The axis values of this plot can be used to infer confidence limits at varying levels of confidence. For example, x axis values at the 0.05 level of the y axis represent the 95% confidence interval limits. Similarly, the x axis values at the 0.10 level of the y axis represent the 90% confidence interval limits. The peak of each curve represents the study point estimate (rate ratio). The two-sided null hypothesis P value (familiar for its common use in statistical significance testing) is the y axis value at which the x axis value is 1 (eg, P ~ 0.10 for breast cancer). CE/BZA, conjugated estrogens/bazedoxifene; EC, endometrial cancer; EH, endometrial hyperplasia; EP, estrogen-progestin hormone therapy; RR, incidence rate ratio.
