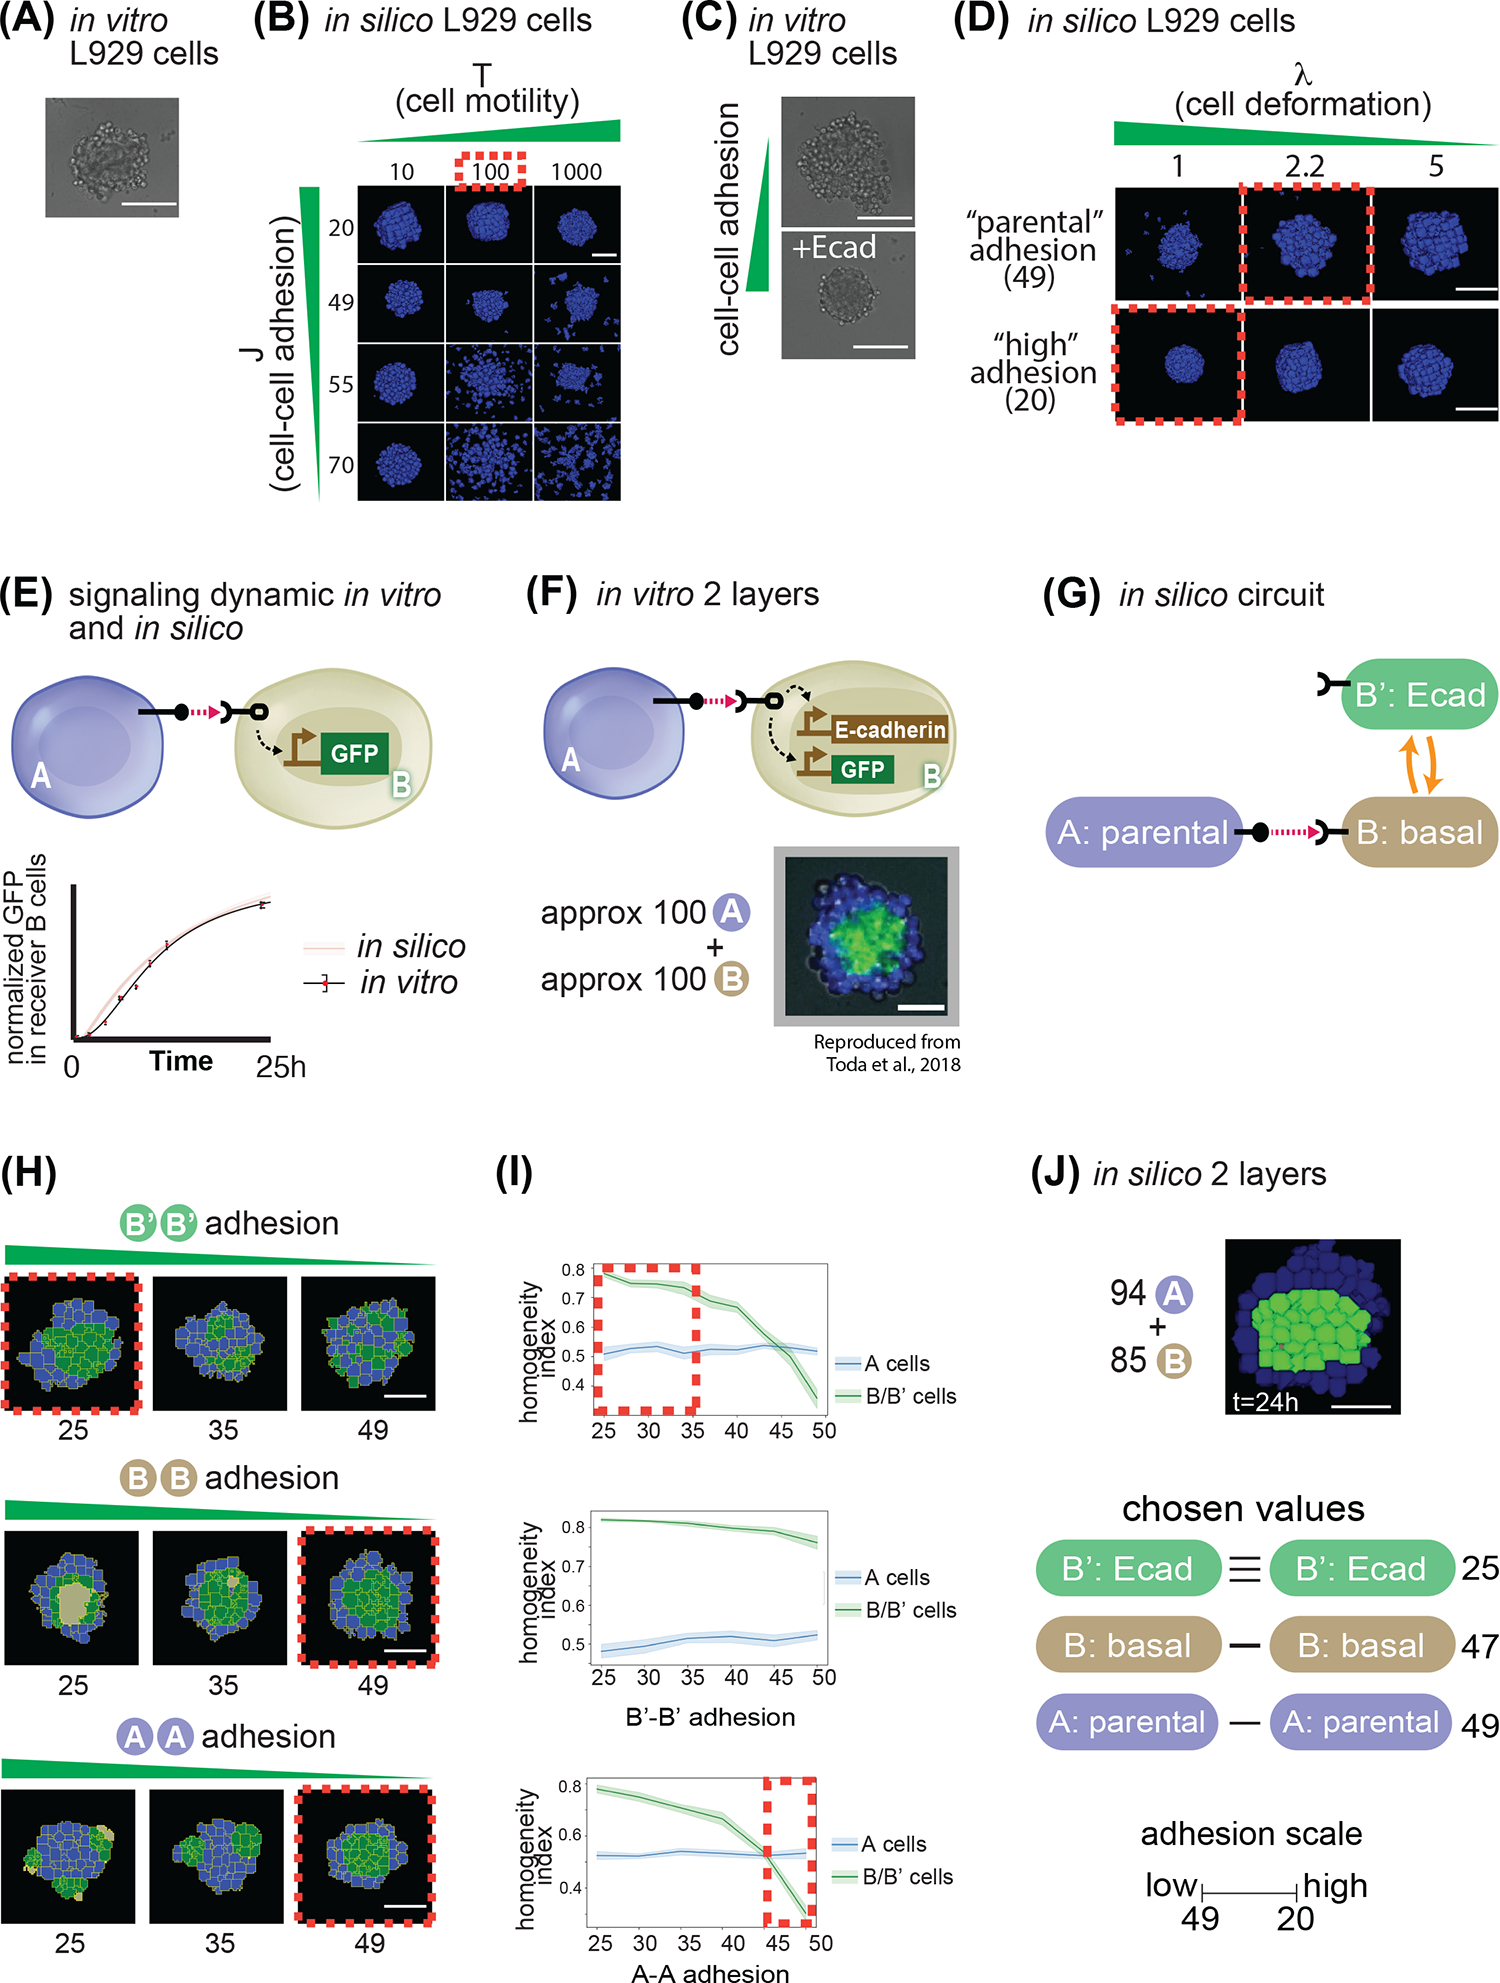
Fig. 3. Model parametrization of signaling and adhesion in A → B networks.

(A) In vitro picture of 100 parental L929 cells grown for 24h in a non-adhesive U-bottom well of a 96-well plate. (B) In silico pictures of 100 identical cells grown in a non-adhesive virtual medium for 24h; as indicated, cells in different snapshots have different parameters for cell movement (x axis) and cell-cell adhesion (y axis). (C) In vitro picture of 100 L929 cells grown for 24h in a non-adhesive U-bottom well of a 96-well plate, either parental (upper picture) or genetically engineered to overexpress E-cadherin (lower picture). (D) In silico pictures of 100 identical cells grown in a non-adhesive virtual medium for 24h; as indicated, cells in different snapshots have different parameters for cell deformation (x axis) and cell-cell adhesion (y axis). (E) Diagram of sender A cells, and receiver B cells that induce GFP downstream of activation of a contact-dependent receptor (left). Below, graph of target gene expression over time for B cells for either in silico simulations (red line + shadow standard deviation) or in vitro experiments (black line). (F) Diagram of sender A cells, and receiver B cells that induce GFP and E-cadherin downstream of activation of a contact-dependent receptor (top). On the bottom is a result of an in vitro experiment after 24h of cultivating approximately 100 A cells with 100 B cells. (G) Depiction of transition network between cell states that is implemented in panel (F). (H) Starting from 100 A and 100B cells where the B’-B’ adhesions where changed (first line), or the A-A (second line) or the B-B (third line). Red dotted lines indicate structure that most closely resemble the in vitro implementation in panel (F). (I) Sorting index quantification of a 24h timepoint of cells A (blue line) or B (green line), for a range of B’-B’ adhesion (first line), A-A adhesions (second line) and B-B adhesions (third line). Red dotted lines represent ranges of behavior that recapitulate in vitro observations. (J) In silico output of input 94 A cells and 85 B cells with the same network as in panel (H), and with the values for adhesion indicated on the right. Scale bar is 17.5pixels in silico, 100um in vitro. Microscope images with gray background are reproduced from Toda, S.; Blauch, L. R.; Tang, S. K. Y.; Morsut, L.; Lim, W. A. Programming Self-Organizing Multicellular Structures with Synthetic Cell-Cell Signaling. Science 2018, 361 (6398), 156–162. 2018 AAAS. Reprinted with permission from AAAS.
