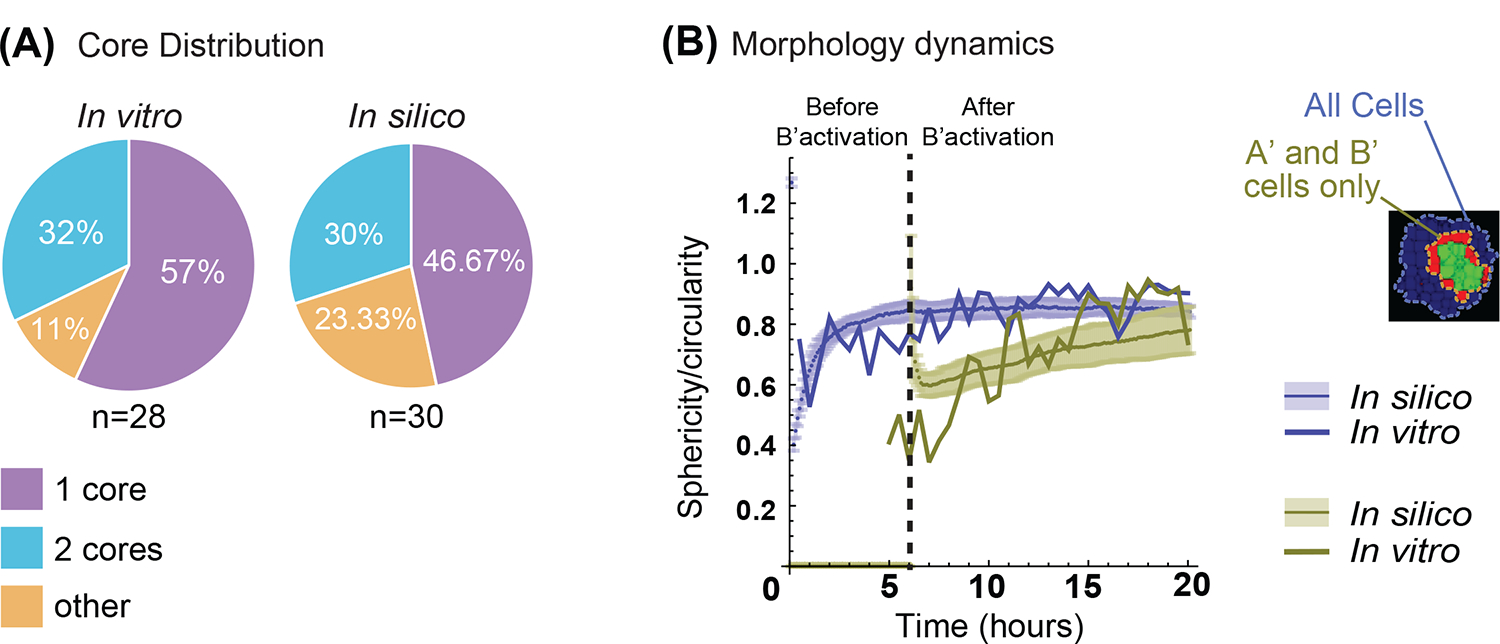
Fig. 5. Emergent properties in vitro are captured by the parametrized system in silico for the central symmetric three layers network.

(A) Quantification of the number of cores formed over repeated simulations (n=30 simulations, n=28 for in vitro). In vitro results data are from19. See Methods, “Quantification and Statistical Analyses; Simulation Quantifications”, for more details on cores definitions in silico. (B) Quantification of sphericity/circularity indexes over the time development of synthetic and in vitro systems. (See methods, Simulation quantifications for in silico, and Video Analysis for in vitro details on the indexes). In blue, all the cells are considered; in green only the activated (A’) and (B’) cells. Solid line is from in vitro measures; solid lines with shaded contours are from in silico measurements and represent mean and standard deviation interval respectively. Vertical dashed line indicates time of (B’) cells activation (n=30 simulations, n=1 for in vitro).
