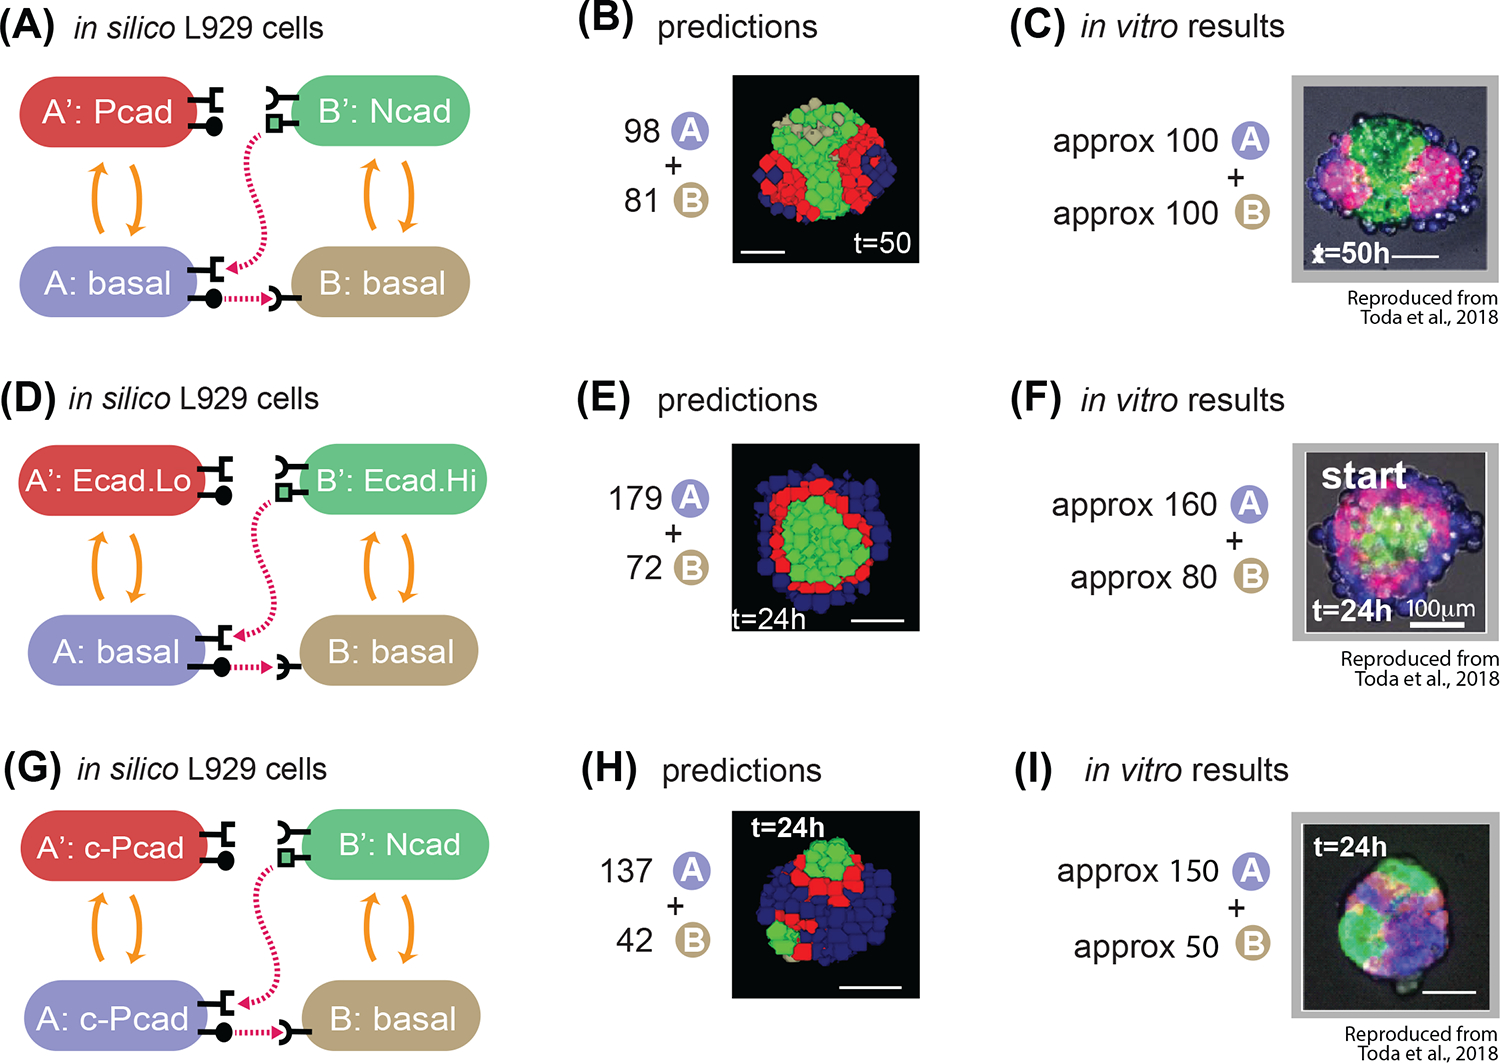
Fig. 7. The model correctly predicts behavior of in vitro experiments with different number of cells.

(A) State-machine diagram of the network, with the adhesion components. B cell has basal adhesion, and rounded receptor; when it is activated by a neighboring rounded receptor it activates to a B’ state that is adhesive with Ncad parameter, produces a square ligand; A cell, blue, has basal adhesion, expresses rounded ligand, and a square receptor; the activation of the square receptor activates A cell to A’, which is red and has adhesion of Pcad parameter. (B) Representative results of resulting structures at t=50h of simulated time of 98A + 81B cells with the genotype as in (7A): a core of green activated B’ cells, with two poles of red activated A’ cells and external to that blue inactivated A cells. See Supplem. Fig. S4 for quantification of homogeneity index over 10 runs of the simulation with the same parameters and initial conditions. (C) In vitro results at t=50h of a representative structure that is obtained with the genotype of cells in (7A), and with mixing approximately 100A cells and 100B cells. Scale bar is 17.5pixels =100um. (D) State-machine diagram of the network, with the adhesion components. B cell has basal adhesion, and rounded receptor; when it is activated by a neighboring rounded receptor it activates to a B’ state that is adhesive with Ecad.Hi parameter, produces a square ligand; A cell, blue, has basal adhesion, expresses rounded ligand, and a square receptor; the activation of the square receptor activates A cell to A’, which is red and has adhesion of Ecad.Lo parameter. (E) Representative result of resulting structures at t=24h of simulated time of approx. 179A + 72B cells with the genotype as in (7D): a core of green activated B’ cells, with a subsequent layer of red A’ activated cells, surrounded by a layer of inactivated blue A cells. See Supplem. Fig. S4 for quantification of homogeneity index over 10 runs of the simulation with the same parameters and initial conditions. (F) In vitro results at t=24h of a representative structure that is obtained with the genotype of cells in (7D), and with mixing approximately 160A cells and 80B cells. Scale bar is 17.5pixels =100um. (G) State-machine diagram of the network, with the adhesion components. B cell has basal adhesion, and rounded receptor; when it is activated by a neighboring rounded receptor it activates to a B’ state that is adhesive with Ncad parameter, produces a square ligand; A cell, blue, has constitutive Pcad adhesion, expresses rounded ligand, and a square receptor; the activation of the square receptor activates A cell to A’, which is red and has continues to have adhesion of constitutive Pcad parameter. (H) Representative results of resulting structures at t=24h of simulated time of 137A + 42B cells with the genotype as in (G): a core of blue inactivated A cells, with multiple poles of green activated B’ green cells, and in the between red activated A’ cells. See Supplem. Fig. S4 for quantification of homogeneity index over 10 runs of the simulation with the same parameters and initial conditions. (I) In vitro results at t=24h of a representative structure that is obtained with the genotype of cells in (G), and with mixing approximately 150A cells and 50B cells. Scale bar is 17.5pixels =100um. Microscope images with gray background are reproduced from Toda, S.; Blauch, L. R.; Tang, S. K. Y.; Morsut, L.; Lim, W. A. Programming Self-Organizing Multicellular Structures with Synthetic Cell-Cell Signaling. Science 2018, 361 (6398), 156–162. 2018 AAAS. Reprinted with permission from AAAS.
