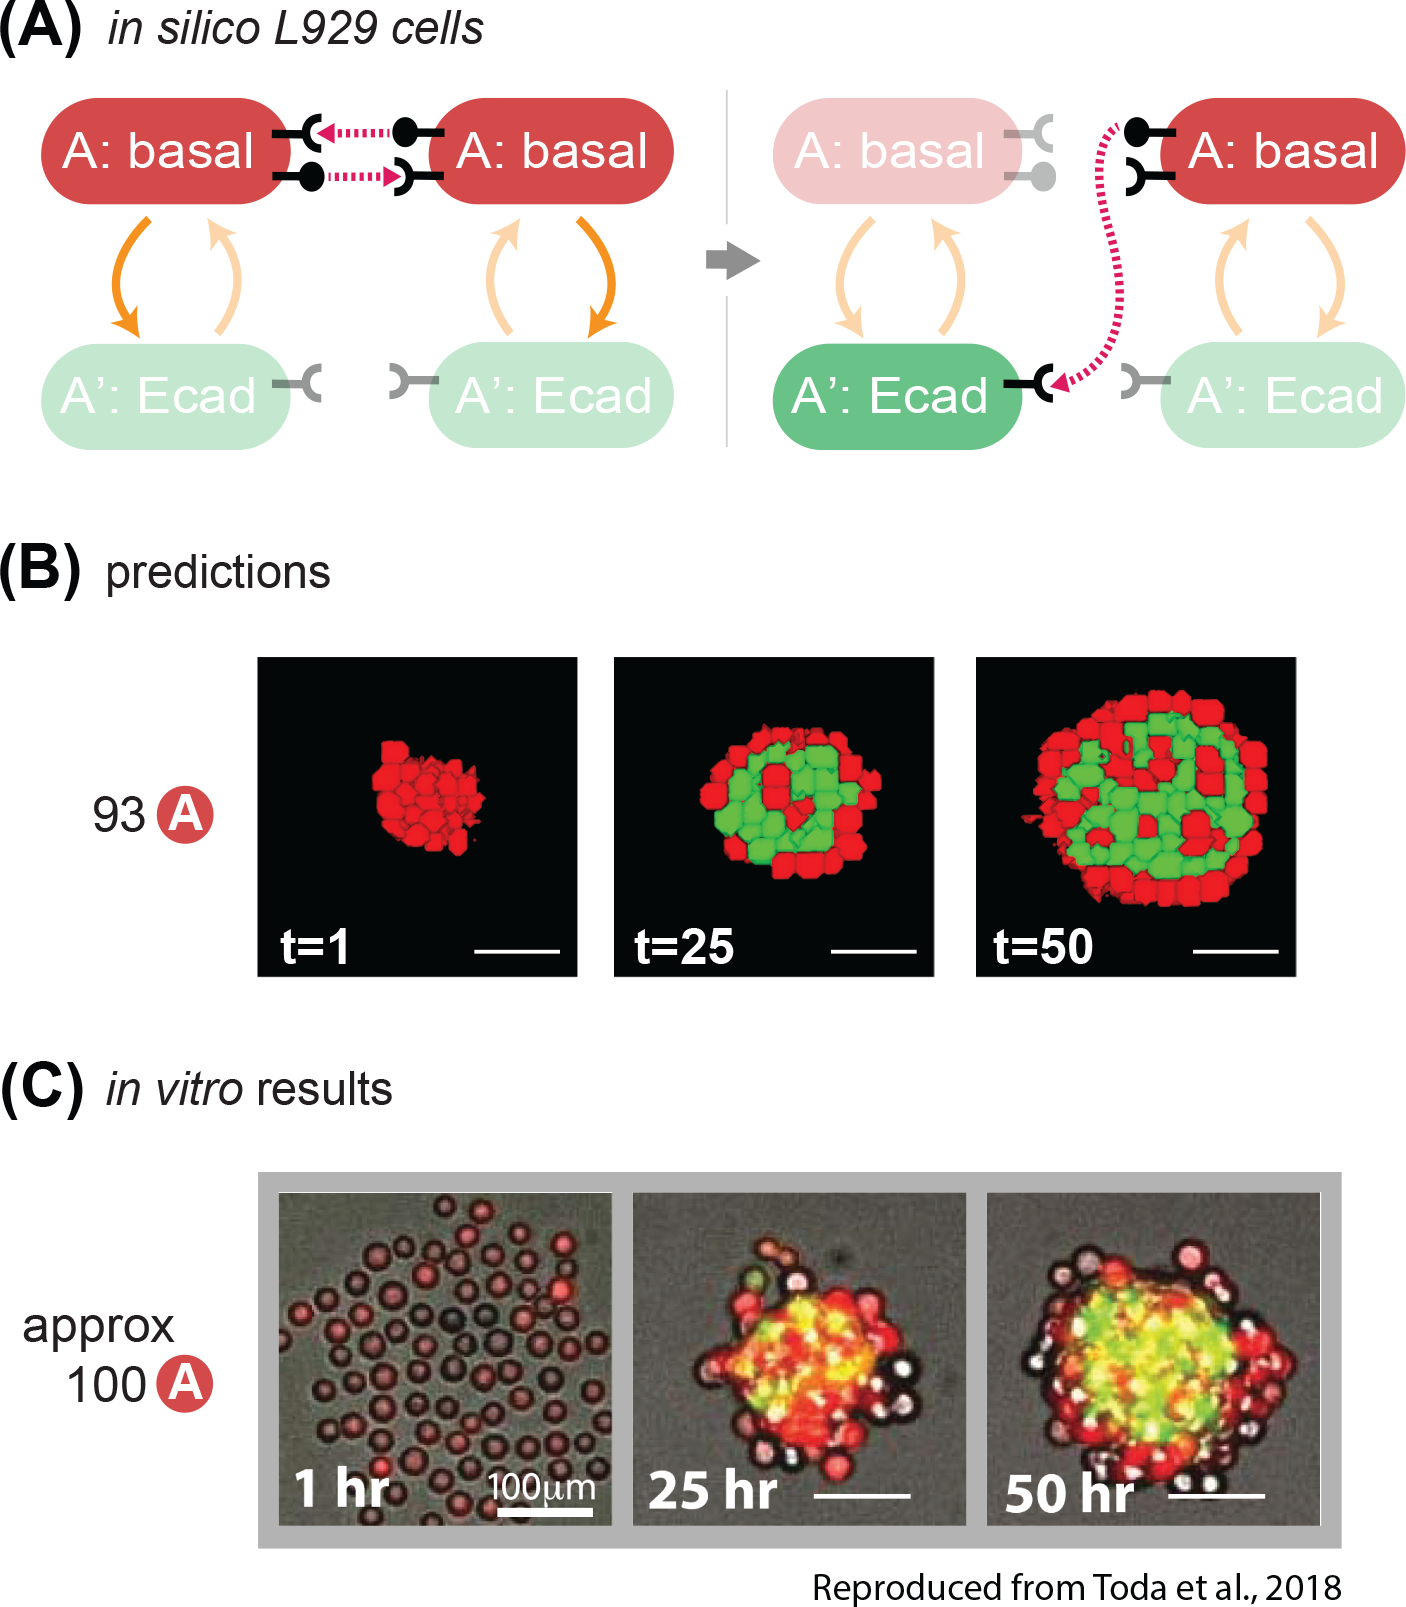
Fig. 8. The model correctly predicts behavior of in vitro experiments with different network wiring.

(A) State-machine diagram of the network, with the adhesion components. Cells of type A are red and have basal adhesion and express both rounded ligand and receptor; when the receptor is activated enough, it can activate A cells to A’ cells, which lose rounded signal expression, gain color green and expression of Ecadherin. (B) Representative results of resulting structures at the indicated timestamp of developmental trajectory starting from 93 cells of type A with the genotype as in (8A); some of the red cells turn green and gather at the center of the core; at t=50, the external layer is of inactivated A cells, and the internal core is a mixture of mainly green cells with interspersed a minority of red cells. See Supplem. Fig. S5 for quantification of homogeneity index over 10 runs of the simulation with the same parameters and initial conditions. (C) In vitro results at the indicated time points of a representative structure that is obtained with the genotype of cells in (8A), starting with 100 A cells. Scale bar is 17.5pixels =100um. Microscope images are reproduced from Toda, S.; Blauch, L. R.; Tang, S. K. Y.; Morsut, L.; Lim, W. A. Programming Self-Organizing Multicellular Structures with Synthetic Cell-Cell Signaling. Science 2018, 361 (6398), 156–162. 2018 AAAS. Reprinted with permission from AAAS.
