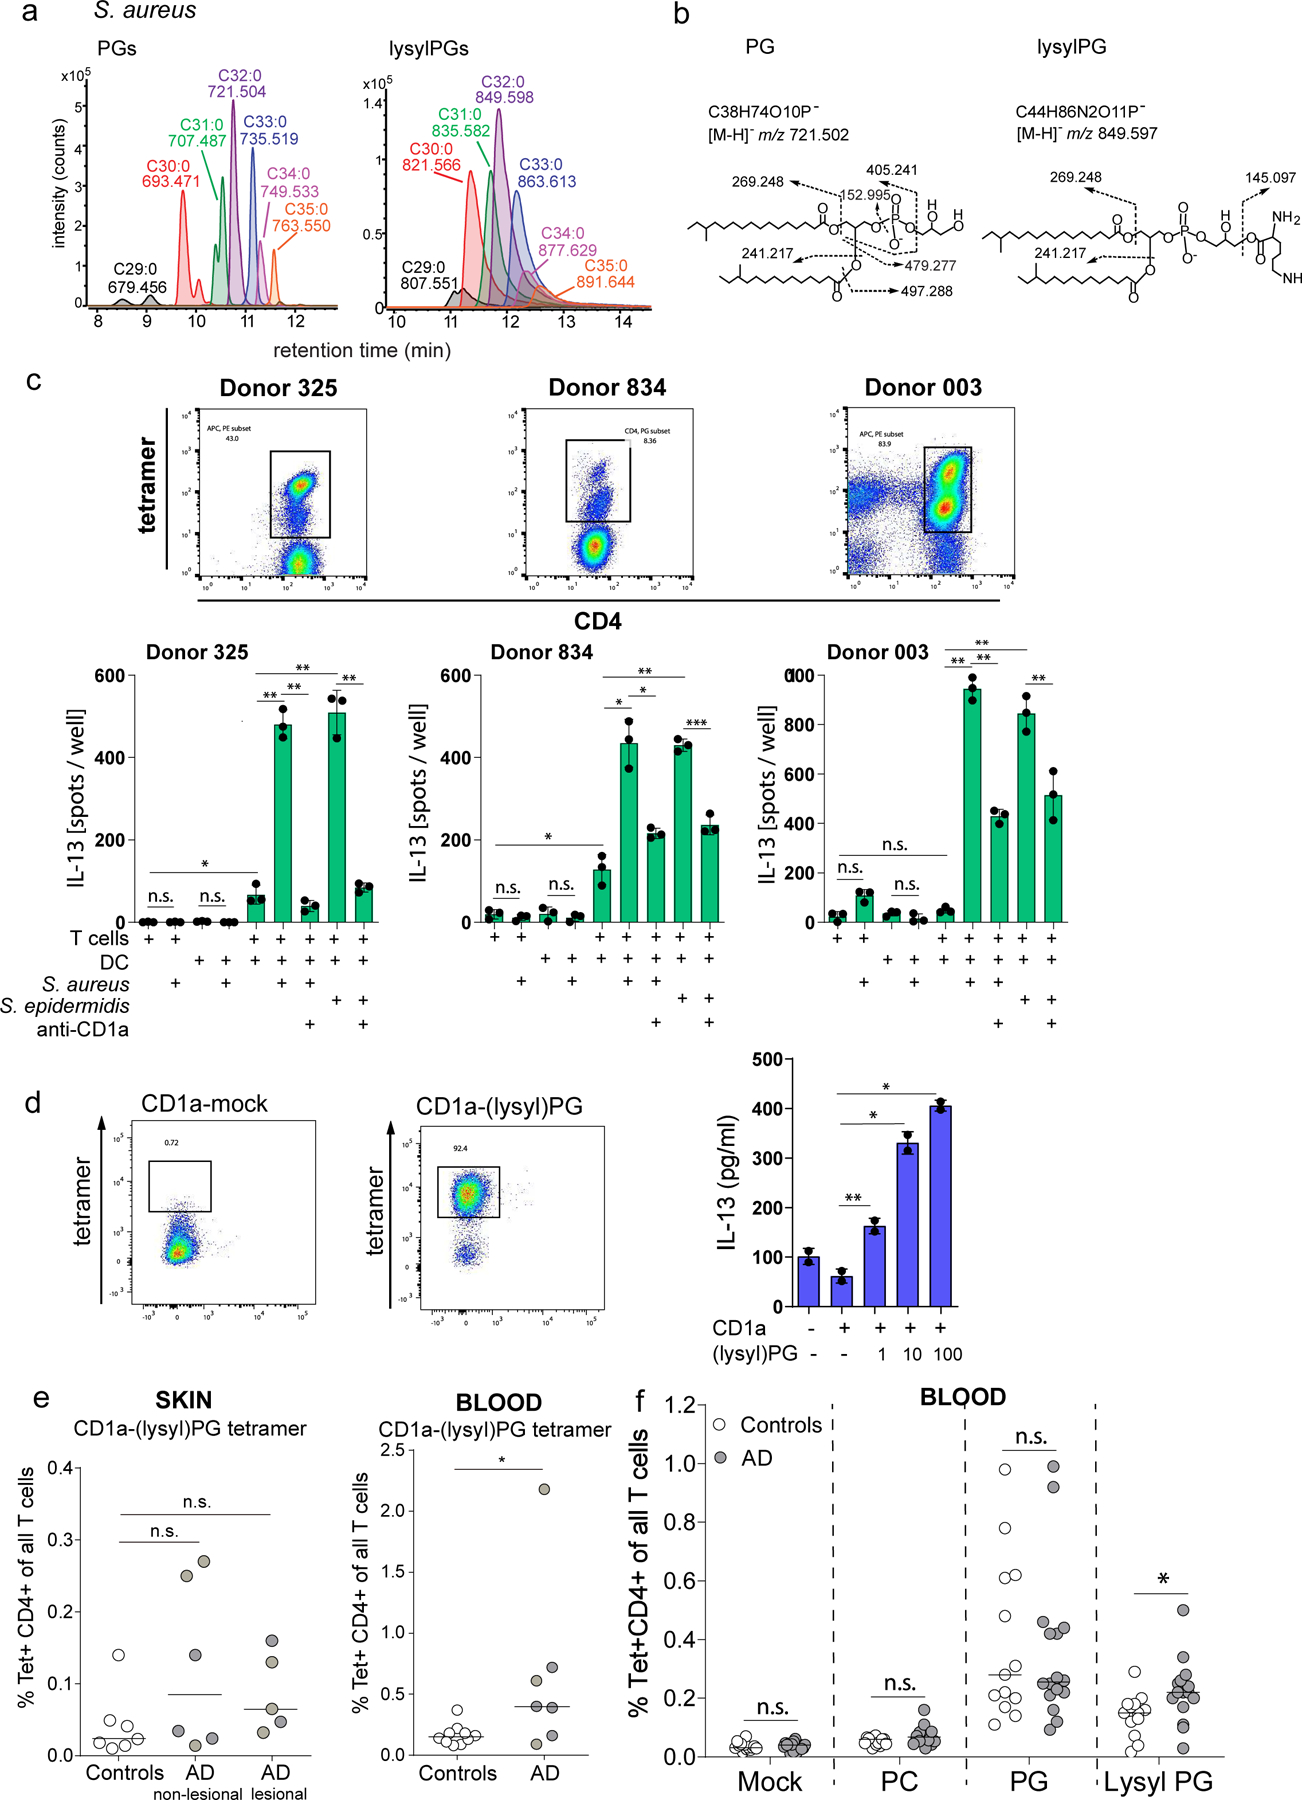
Figure 6. Response to Staphylococcal bacteria and CD1a-(lysyl)PG tetramer+ T cells in Atopic Dermatitis.

(a) Mass chromatograms of major species of PGs and lysylPGs from S. aureus SA113 were analyzed by negative-mode, reversed-phase HPLC-QToF-MS. The length and saturation of the combined fatty acyl chains were deduced by the detected m/z matching the structural formula. (b) CID-MS of the most abundant species in PG (left) and lysylPG (right) showed the diagnostic fragments of phosphoglycerol (m/z 152.995) and lysine (m/z 145.097) for PG and lysylPG, respectively. (c) IL-13 ELISpot of purified CD1a-PG tetramer-sorted T cells from lines 325, 834 and 003, co-cultured with monocyte-derived dendritic cells pre-incubated with media or live S. aureus or S. epidermidis bacteria. CD1a-restriction was determined by pre-incubating DC and bacteria with anti-CD1a (OKT6). Depicted is the mean ± SD of triplicate co-cultures. P-values were based on the paired two-tailed t-test. n.s. = not significant, * p<0.05, ** p<0.01, *** p<0.001. (P-values donor 325: p=0.036, p=0.0059, p=0.0033, p=0.0014, 0.0038. P-values donor 834: p=0.017, p=0.023, p=0.0032, p=0.018, p=0.0002. P-values donor 003: p=0.0010, p=0.0028, p=0.0058, p=0.0017) (d) CD1a-(lysyl)PG tetramer sorted skin T cell line (skinT4) stained with mock-treated and lysylPG-treated CD1a tetramers and analyzed by flow cytometry, gate: live cells. IL-13 release measured by ELISA in supernatant of co-cultures of skinT4 with plate bound CD1a loaded with indicated concentrations of lysylPG (µg/ml). Depicted is the mean ± SD of duplicate cultures. P-values were based on the paired two-tailed t-test, *p<0.05, **p<0.01 (P-values: p=0.006, p=0.014, p=0.033). Results are representative of 3 independent experiments. (e, left graph) CD1a-(lysyl)PG tetramer staining of expanded skin T cells (controls n=7, AD non-lesional n=6, AD lesional n=5). e, right graph) CD1a-(lysyl)PG tetramer staining of PBMC (controls n=10, AD n=7). Gating strategy according to Supplementary Figure 1a). Plotted are the percentages of CD1a-(lysyl)PG tetramer+ CD4+ T cells among all T cells. Medians are indicated with horizontal bars. P-values were based on the exact Wilcoxon rank sum test, two-sided. *P<0.05, n.s. = not significant. (P-values: p=0.11, p=0.22, p=0.027) (f) In a separate cohort of AD patients and healthy controls % of CD1a tetramer+ CD4+ T cells was measured using indicated tetramers (Gating strategy according to Supplementary Figure 1b). Plotted are the percentages of CD1a-tetramer+ CD4+ T cells among all T cells for controls (n=13) and AD patients (n=16). Medians are indicated with horizontal bars. For each tetramer, comparison between AD and controls was performed using the exact Wilcoxon rank sum test, two-sided. *p<0.05, n.s. = not significant (p=0.72, p=0.094, p=0.87, p=0.012).
