Figure 1.

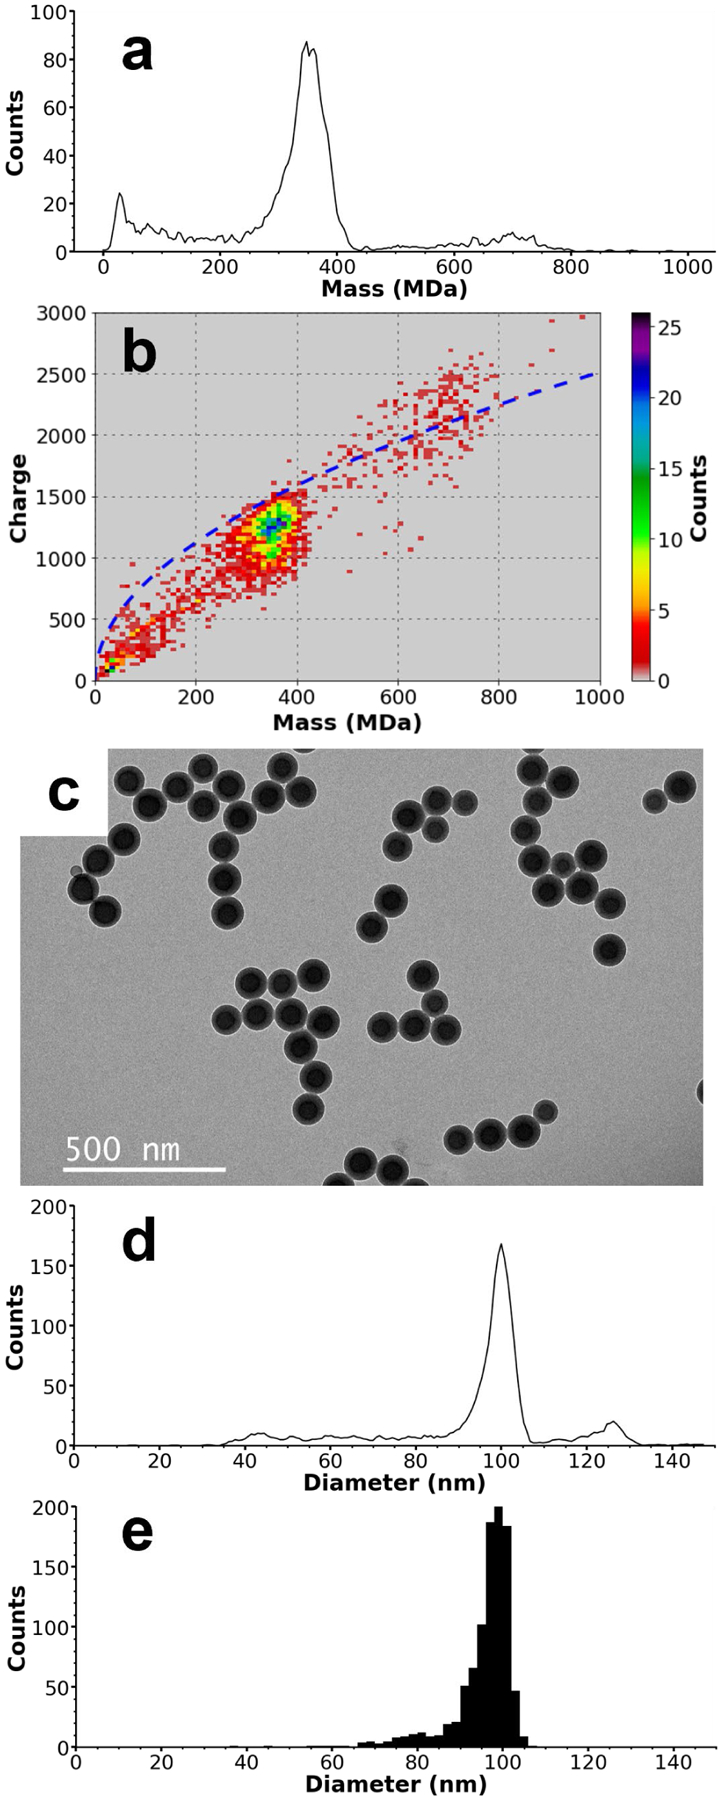
CDMS and TEM data for ~100 nm standardized nanoparticles. A mass histogram composed of 2,509 individual ions is shown in (a), with peaks at ~32 MDa, ~354 MDa, and ~705 MDa, corresponding to contaminants, the ~100 nm standardized nanoparticles, and nanoparticle dimers, respectively. The non-spherical shape of the dimer species is confirmed in (b), a two-dimensional mass v. charge histogram. The blue dashed line is the Rayleigh charging limit of spherical droplets as a function of mass. Spherical molecules, such as the ~100 nm nanoparticles at ~354 MDa, are typically charged to less than ~100% of the Rayleigh limit, but non-spherical molecules, such as the dimers at ~705 MDa, can charge above this value because to their larger relative surface area allows charge to be spread out and reduces Columbic interactions. A representative TEM image of the ~100 nm standard nanoparticles is shown in (c). Diameters derived from the CDMS mass data are shown in (d) and can be compared with the diameters measured using TEM images shown in (e). The main distribution in the CDMS-determined diameters has a peak value of 101.5 nm compared to the 98.5 nm determined from TEM. The CDMS-determined diameters in (d) exhibit a spurious peak at ~127 nm originating from the non-spherical dimer masses, but the similarity in peak shape and peak values between the main distributions of both (d) and (e) demonstrate indicate good agreement between the two methods for sizing nanoparticles.
