
Figure 2.
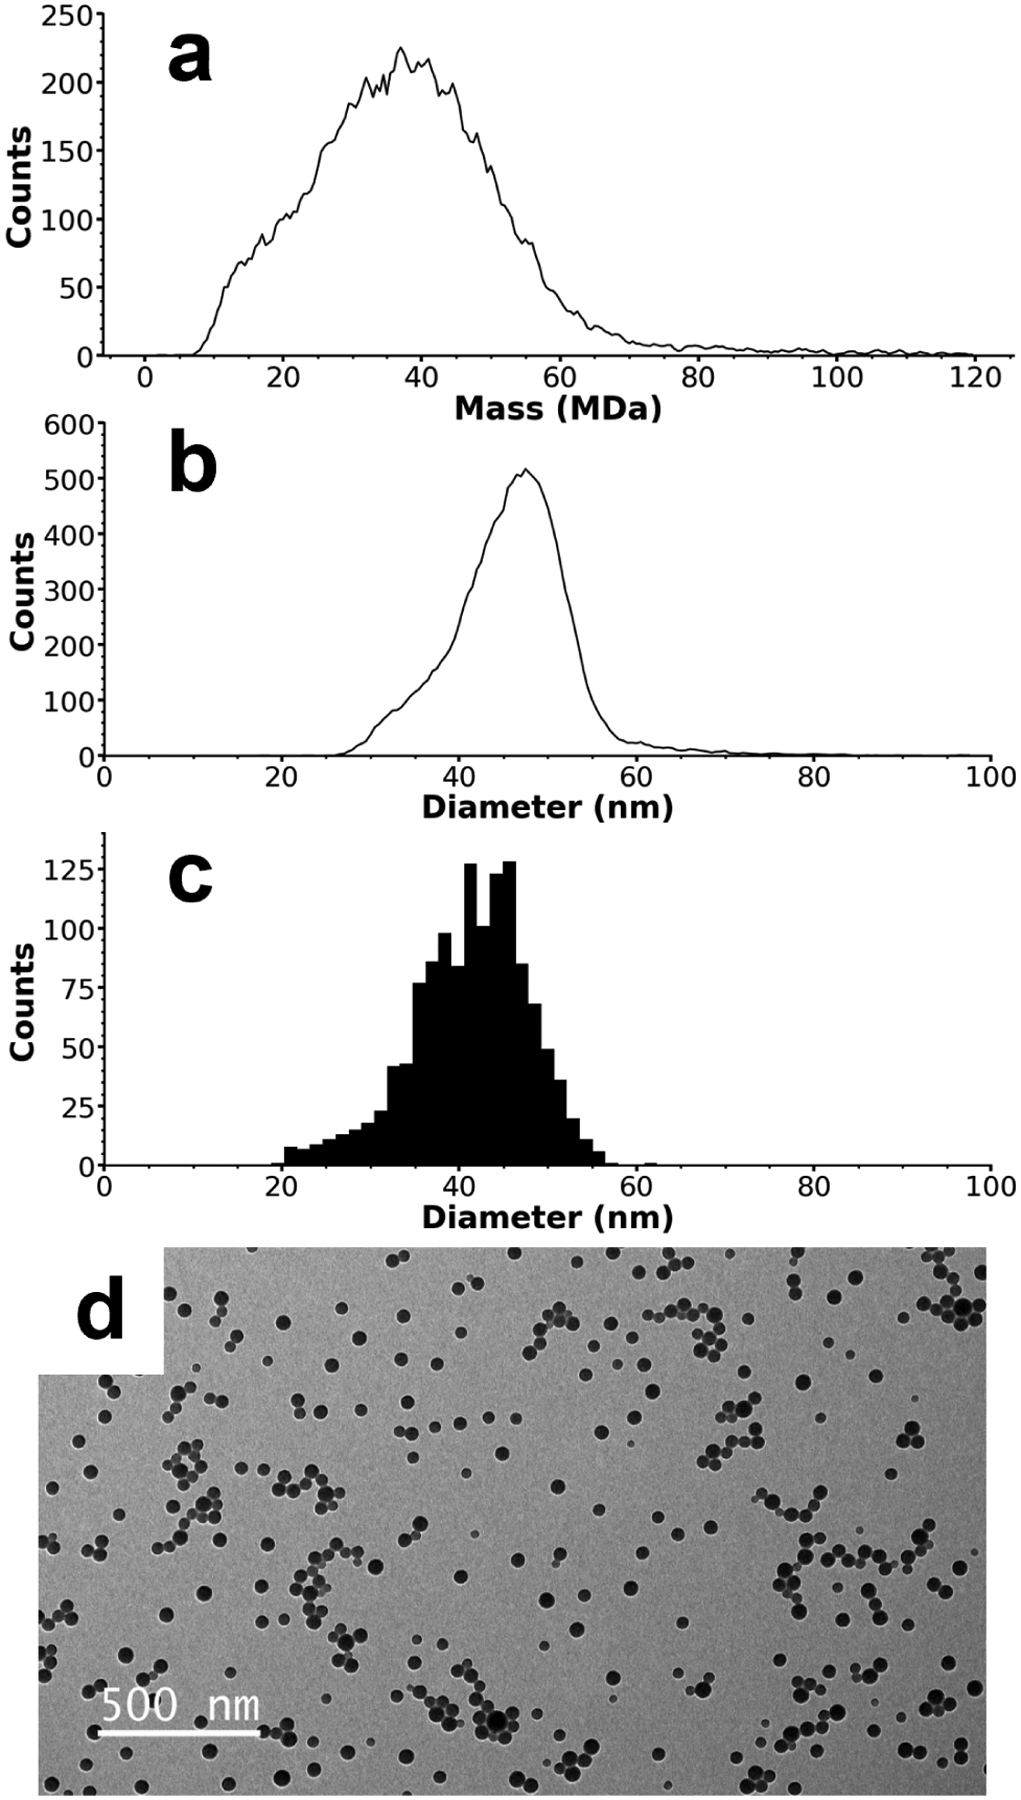
CDMS and TEM data for ~50 nm amine-functionalized nanoparticles. A mass histogram composed of 14,455 individual ions is shown in (a), with a single broad peak centered at ~37 MDa. Diameters derived from the CDMS mass data are shown in (b) and can be compared with the diameters measured using TEM shown in (c). The CDMS diameters have a peak centered at 47.5 nm compared to 42 nm for the TEM data. Despite this difference, both size distributions have approximately the same shape, indicating a relative systematic error between the two methods that may originate from the amine-functionalized surface of these nanoparticles. A representative TEM image of the nanoparticles is shown in (d).