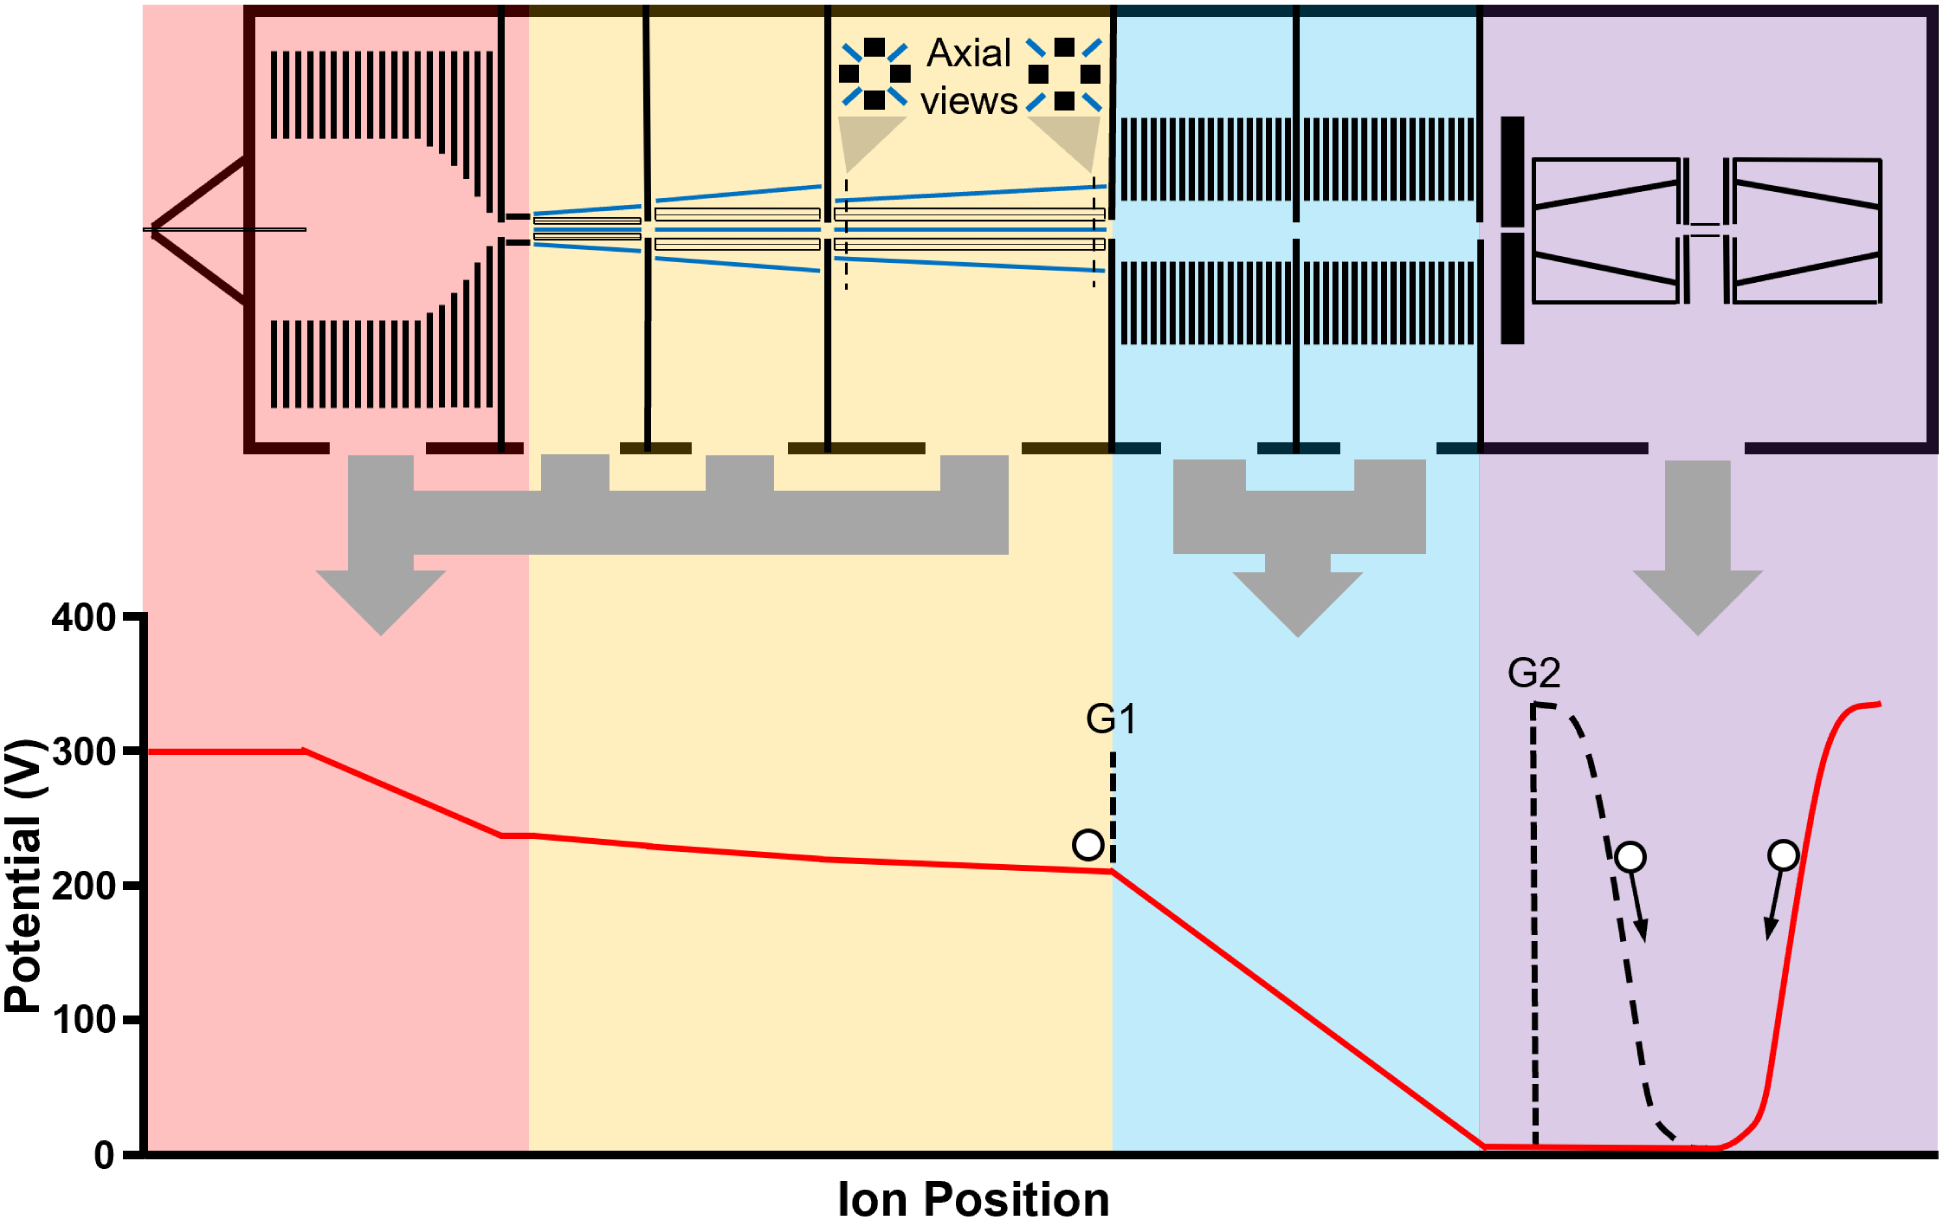
Figure 3.

A schematic of the recently constructed CDMS instrument used in this work and the DC ion optics potentials experienced by an ion as it transits the instrument. The instrument is divided into four main regions: an initial drying and funnel stage (red), a quadrupole thermalization and accumulation stage (yellow), an ion acceleration stage (blue), and the electrostatic ion trap stage (purple) where the induced current of ions oscillating within the trap is used to measure ion masses. The black dashed lines at points G1 and G2 indicate potentials experienced by ions during the “closed” accumulation and trapping state while the red line indicates potentials during the “open” state.
