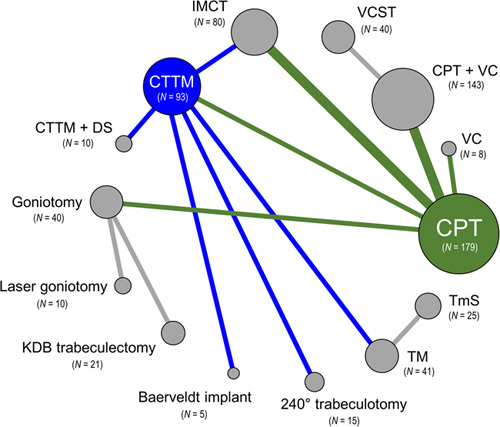
Figure 2.

Network plot of primary outcome. Surgical interventions, with direct comparisons, are linked by lines, with the width of the lines being proportional to the number of trials comparing each pair of interventions. The size of each node is proportional to the number of eyes of participants (i.e. sample size) randomly assigned to each intervention. Green lines indicate direct comparisons with conventional partial trabeculotomy (CPT); blue indicates direct comparisons with combined trabeculectomy-trabeculotomy with mitomycin C (CTTM); gray indicates direct comparisons between other interventions. DS, deep sclerectomy; IMCT, illuminated microcatheter‐assisted circumferential trabeculotomy; KDB, Kahook dual blade; TM, trabeculectomy with mitomycin C; TmS, trabeculectomy with modified scleral bed; VC, viscocanalostomy; VCST, visco-circumferential-suture-trabeculotomy.
