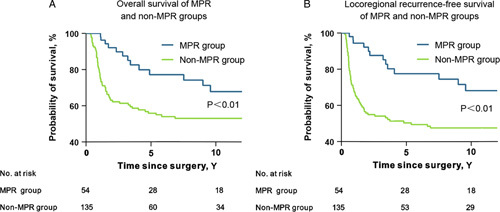
Figure 3.

Survival curves of major pathologic response (MPR) and non-MPR groups. (A) Overall survival and (B) locoregional recurrence-free survival of MPR and non-MPR groups. Kaplan–Meier method was used for survival analysis. Log-rank P values were presented in the figure.
