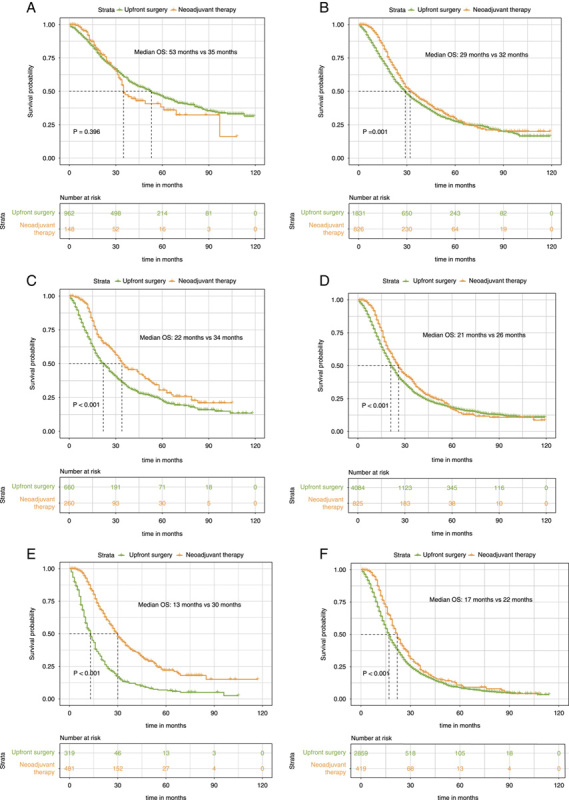
Figure 3.

Kaplan–Meier survival curves for overall survival between patients of the upfront resection group and patients of the neoadjuvant therapy followed by surgery group for clinical stage IA (A), clinical stage IB (B), and clinical stage IIA (C), clinical stage IIB (D), clinical stage III-T4 (E), and clinical stage III-N2 (F) patients in the unmatched data.
