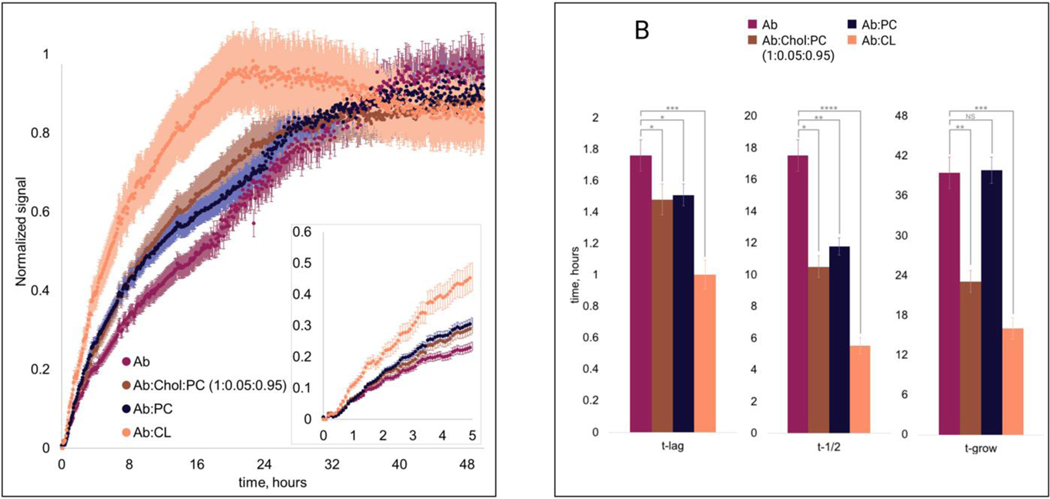
Figure 1.
ThT kinetics (A) of (amyloid ) aggregation in presence of LUVs (large unilamellar vesicles) and the lipid-free environment with the histograms (B) of , , and , where statistical analysis was performed Using One-way ANOVA, shows significant differences for all testing groups, n-value – 10, P-value – 0.000232. Two-tailed Student’s t-test was performed for multiple comparison procedures and the statistical test error bars represent Standard Deviation.

