
Figure 5.
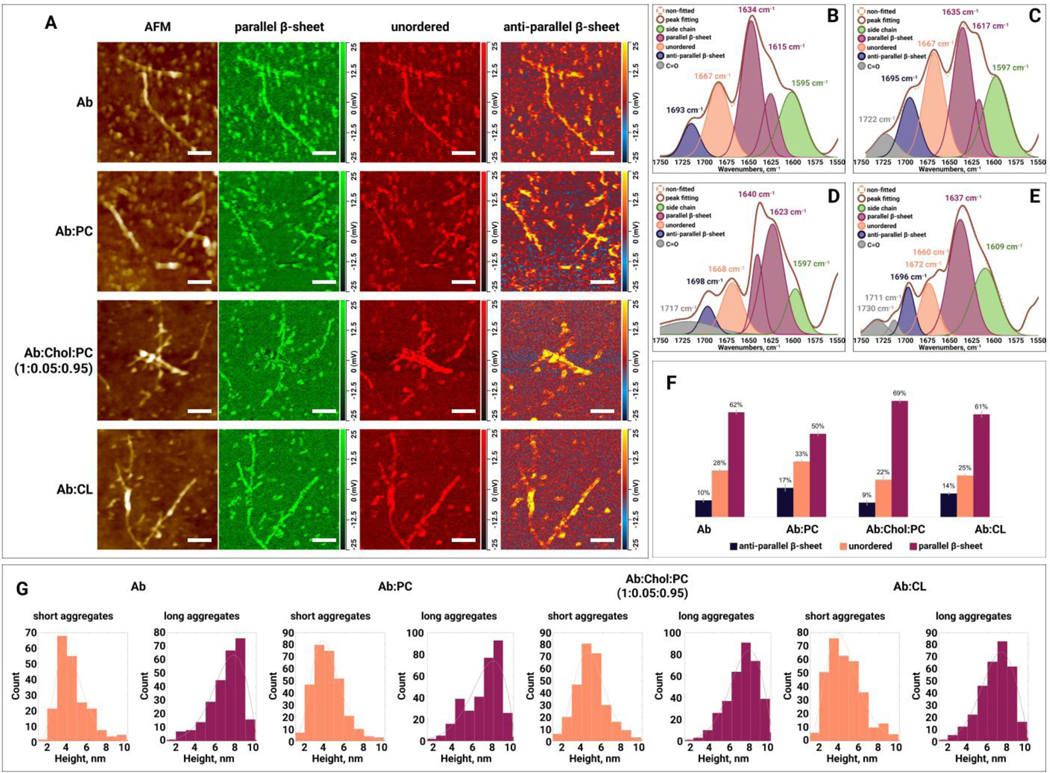
(A) AFM height images and IR absorption maps of (amyloid ) formed at the late stage (48h) of protein aggregation in the absence and presence of PC (phosphatidylcholine), Chol (cholesterol) :PC and CL (cardiolipin). IR absorption maps at 1630 cm−1 reveal distribution of parallel -sheet, at 1667 cm−1 unordered protein, and at 1694 cm−1 anti-parallel -sheet. Scale bars are 200 nm. Averaged IR spectra of (B), :PC (C), :Chol:PC (D) and :CL (E) oligomers with the fitted protein secondary structures. Histogram (F) summarizes relative amount of parallel -sheet, unordered protein and anti-parallel -sheet in the analyzed oligomers. Statistical analysis was performed Using One-way ANOVA, shows significant differences for all testing groups, n-value – 10, P-value – 0.000942. Tukey’s HSD Post Hoc was performed for multiple comparison procedures and the statistical test, showed the following difference between tested groups, error bars represent Standard Deviation. Corresponding P-values listed in supplementary tables. (G) Height profile of short and long aggregates at the early stage (48h) of protein aggregation in the absence and presence of PC, Chol:PC and CL.