
Fig. 2. Magnitude of excretion of poliovirus type 1 and type 3 after bOPV challenge for each study arm and age group.
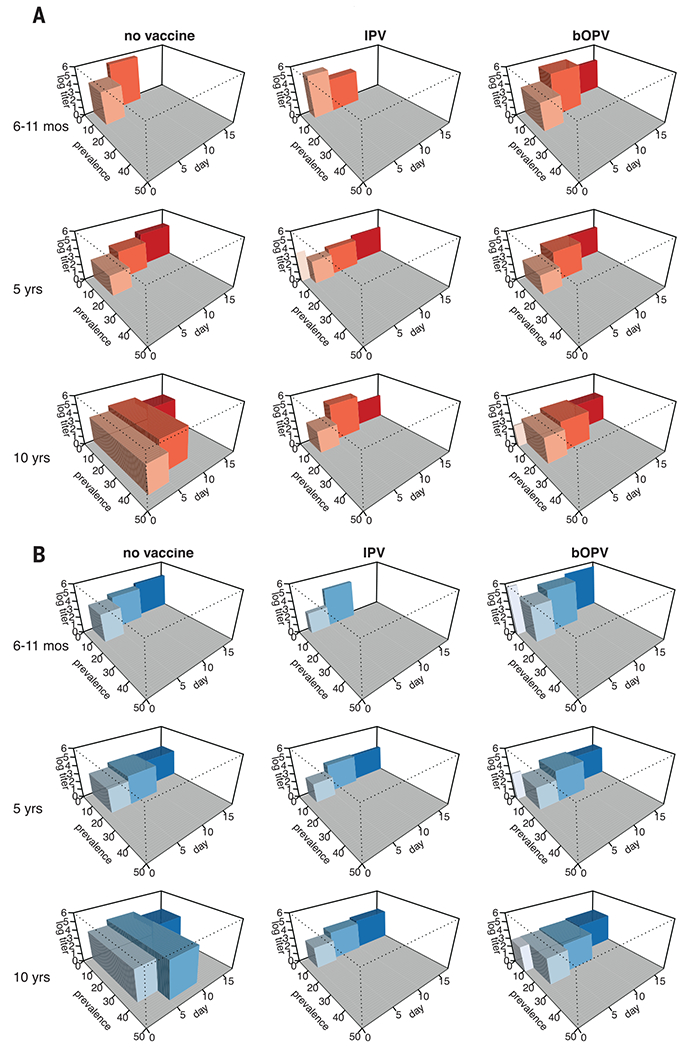
The prevalence of poliovirus type 1 (A) and type 3 (B) excretion and the mean log10 titer are plotted for each time point after challenge, with the width of the boxes spanning the midpoints between these time points (except for those boxes representing shedding on the day of challenge, where the plot is truncated at day 0). The volume of the boxes therefore roughly represents the total quantity of poliovirus that is excreted (prevalence × quantity × duration). Prevalence measure includes 954 participants. Titer measure includes 303 participants excreting virus after bOPV challenge.