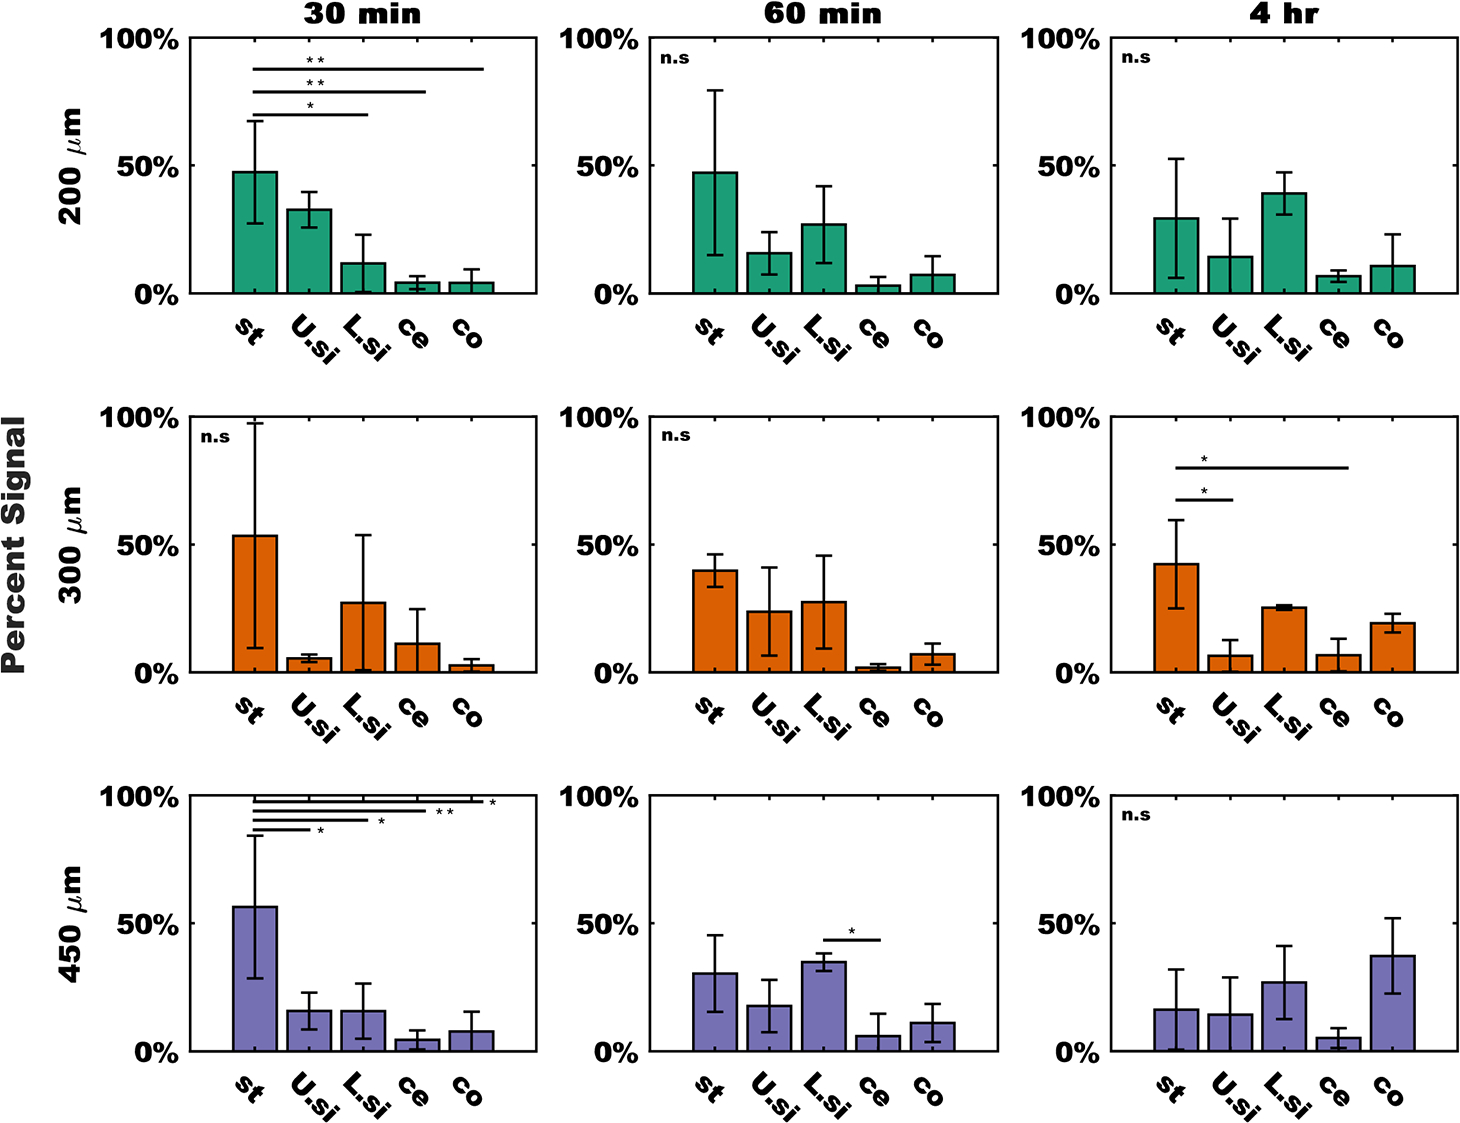
Figure 4.

Fluorescent signal from discrete tissue regions demonstrates device transit through tissue. Signals divided by device group (rows) and time (columns). Data were normalized to the total amount of signal in each sample and expressed as a percentage. From the left to right in each plot bars represent signal from the stomach (st), upper small intestine (U.si), lower small intestine (L.si), cecum (ce), and colon (co). Data were expressed as the sample mean ±1 SD, n = 3 measurements per group for the 200 μm devices (green) and 450 μm devices (purple), n = 2 measurements per groups for 300 μm devices (orange). Statistical difference between groups was determined by one-way ANOVA followed by a Tukey-Kramer correction for multiple comparisons. * = p < 0.05, ** = p < 0.01. ns = no significant differences measured.
