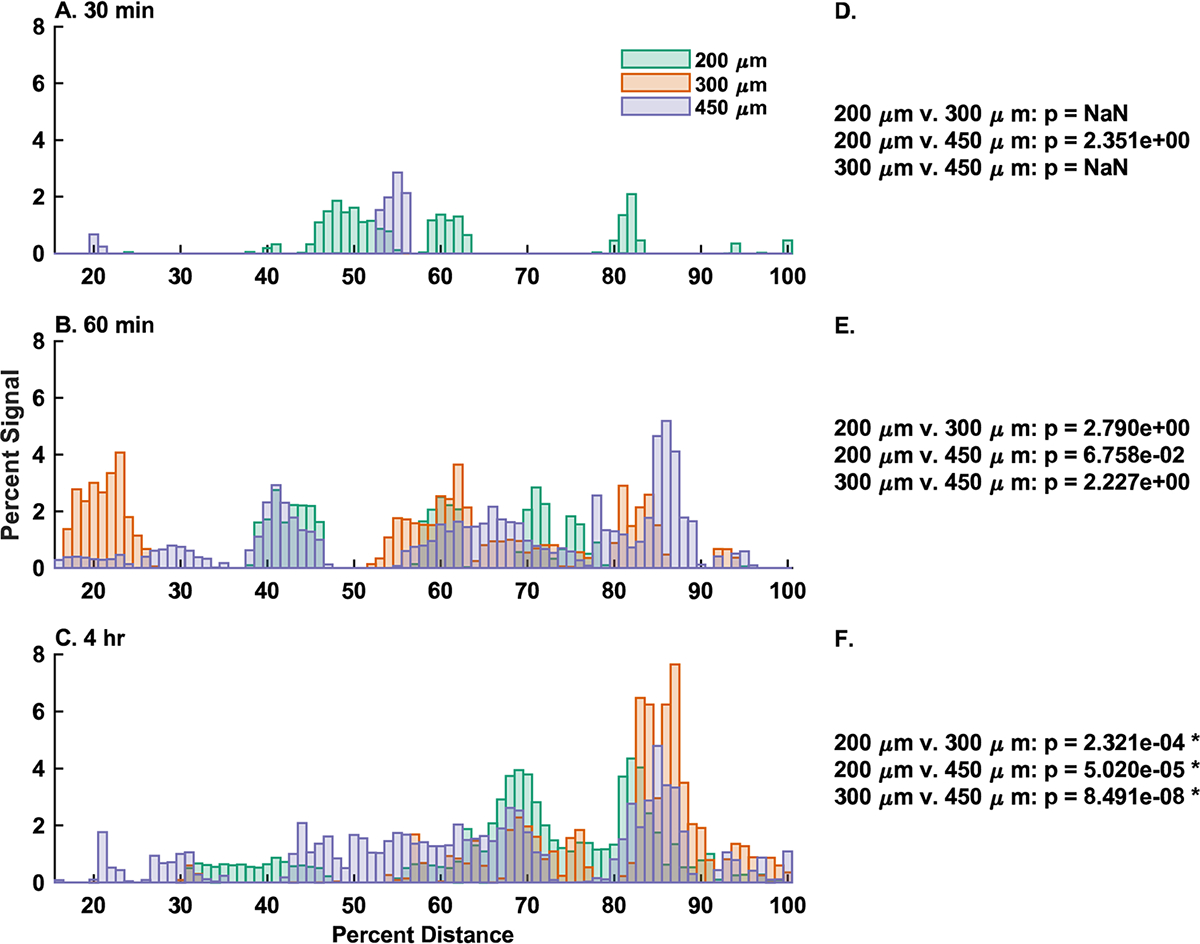
Figure 6.

Comparison of distribution signals by-time indicate group stratification. (A–C) Overlays of each device group at (A, D) 30 min, (B, E) 60 min, and (C, F) 4 h presented after gastric emptying (15–100% total distance). Signal data are normalized to the total signal present in each sample, and distance is normalized to the total distance along the GI tract. Each bar represents the arithmetic mean of the cumulative signal from the preceding 1% of total distance from n = 3 animals for the 200 and 450 μm groups, and n = 2 animals for the 300 μm group. (D–F) Cross correlation results for pairwise comparisons between groups. p-values less than p = 0.05 represent a statistically significant correlation between the indicated signals, whereas larger p values fail to reject the null-hypothesis of no correlation. In the 30 min group (D), there was insufficient signal from the 300 μm group for comparison. Family-wise error rate was limited to α = 0.05 using a Bonferroni correction for multiple comparisons. * = p < 0.05 and indicates a statistically significant correlation.
