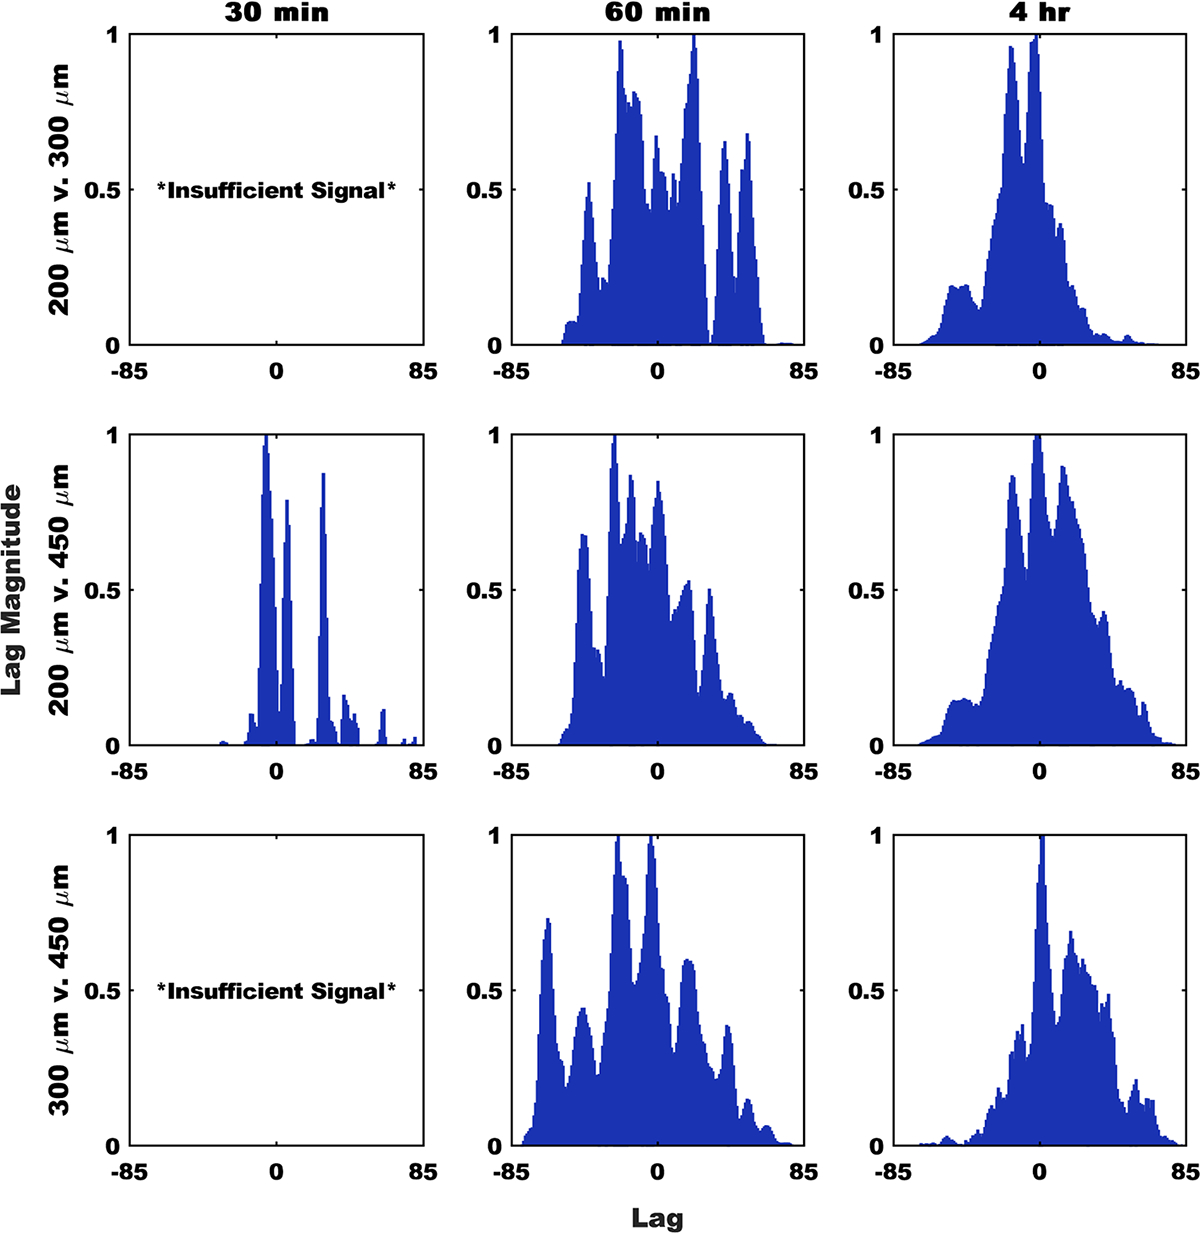
Figure 7.

Signal lag shows devices accumulate differentially along the GI tract over time. The presented biased correlation lag analysis results account for shifts along the entirety of the analyzed portion of the GI tract (excluding the stomach). Signals were normalized to the maximum in each group. Peaks at positive lag values represent the second term needing to shift in the positive direction to match the first term, whereas negative lag values indicate the second term moving in the negative direction. Because of an insufficient signal, no comparisons to the 300 μm group were possible at the 30 min time point.
