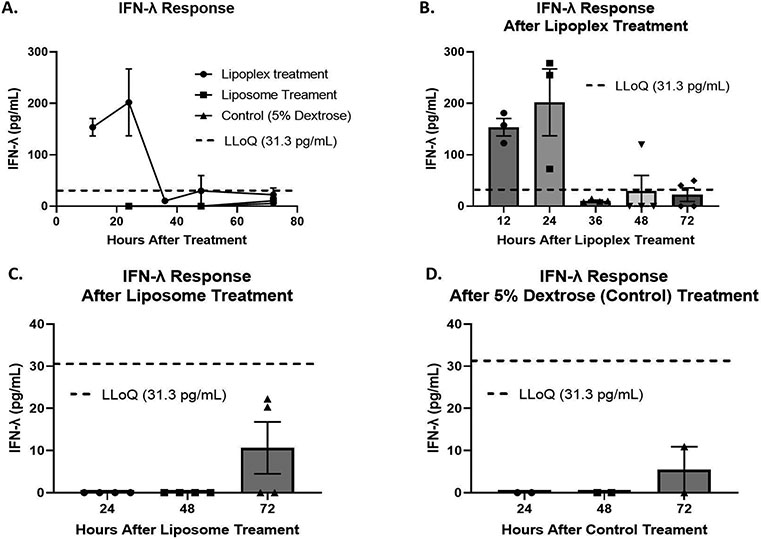
FIGURE 4:
A: Quantification of IFN-λ in serum of Balb/c female mice after lipoplex, liposome, and 5% dextrose treatment using ELISA. B: Quantification of IFN-λ in serum of mice after lipoplex treatment C: Quantification of IFN-λ in serum of mice after liposome treatment D: Quantification of IFN-λ in serum of mice after 5% dextrose (control) treatment. Error bars represent the mean and the standard error of the mean. Lower limit of quantification (LLoQ) of ELISA: 31.3 pg/mL. Lower limit of detection (LLoD) of ELISA: 3.9 pg/mL. Lipoplex treatment n = 3 – 4. Liposome treatment n = 4. Control treatment n = 2.

