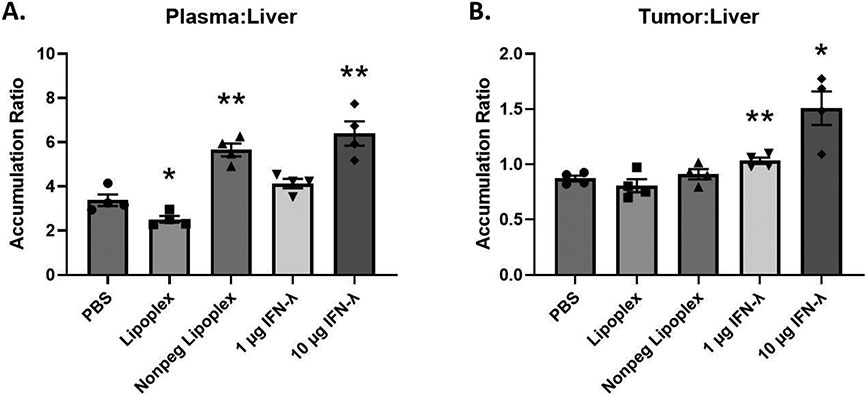
Figure 7:
Plasma/liver and tumor/liver Doxil accumulation ratios. X-axis represents the pretreatment that the mice received. A t-test with Welch’s correction was used to determine if Lipoplex and IFN-λ pretreatments showed statistically significant differences in accumulation ratios when compared to PBS pretreatment. Statistically significant differences are represented with asterisks (* = p ≤ 0.05, ** = p ≤ 0.01) (A. – B.: n = 4).

