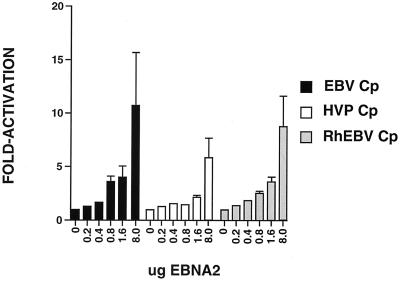
FIG. 4.
Analysis of the EBNA2 responsiveness of EBV, HVP, and RhEBV Cps. DG75 cells were transfected with 2 μg of target plasmid and 0, 0.2, 0.4, 0.8, 1.6, and 8.0 μg of effector EBV EBNA2-expressing plasmid (24). Results are averages of values from five independent experiments. Standard errors of the means are indicated with the T bars.

