Figure 5.
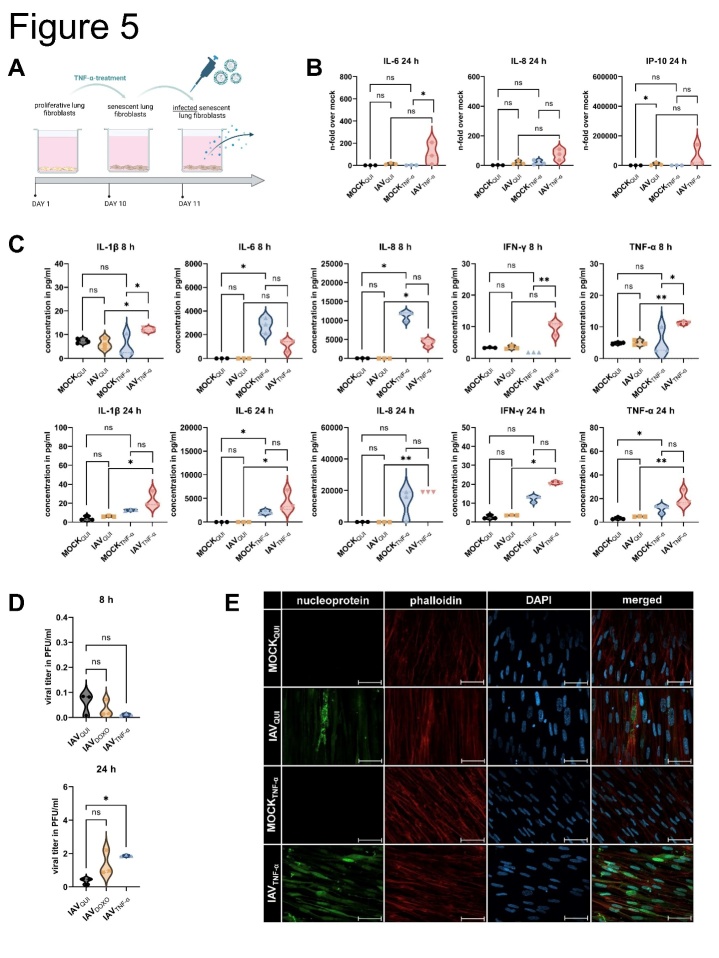
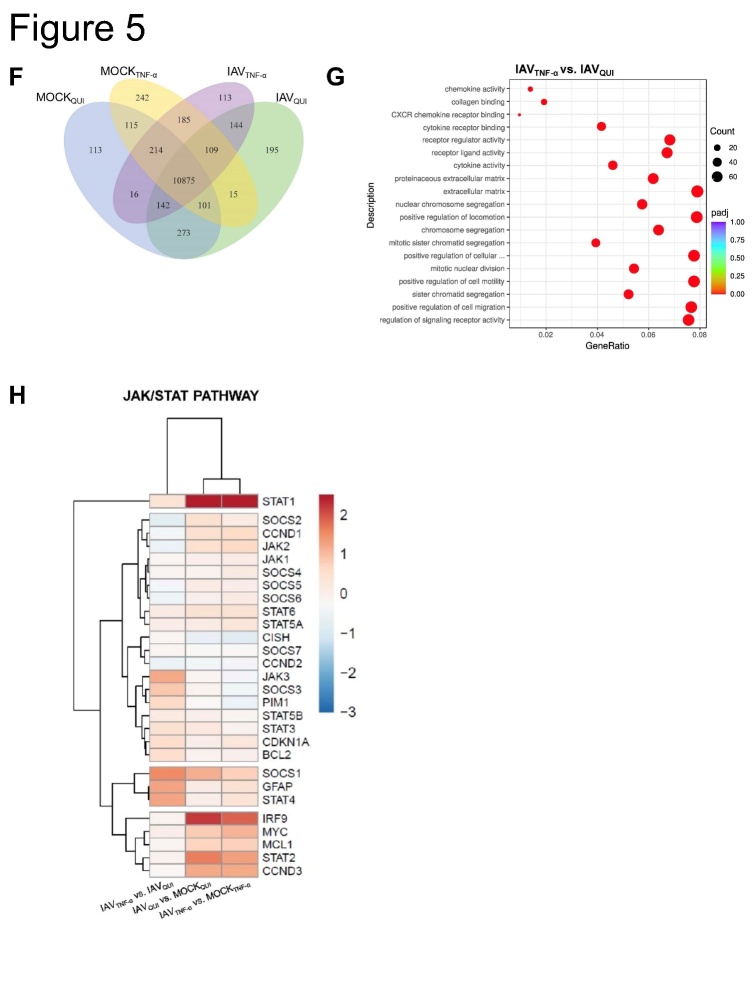
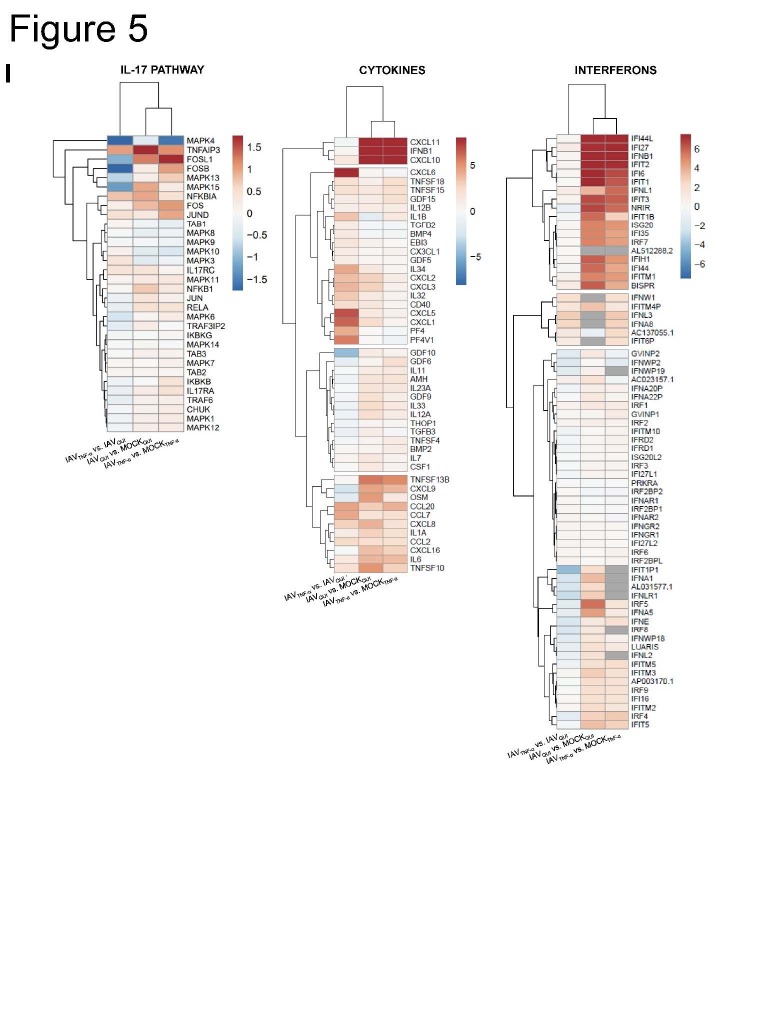
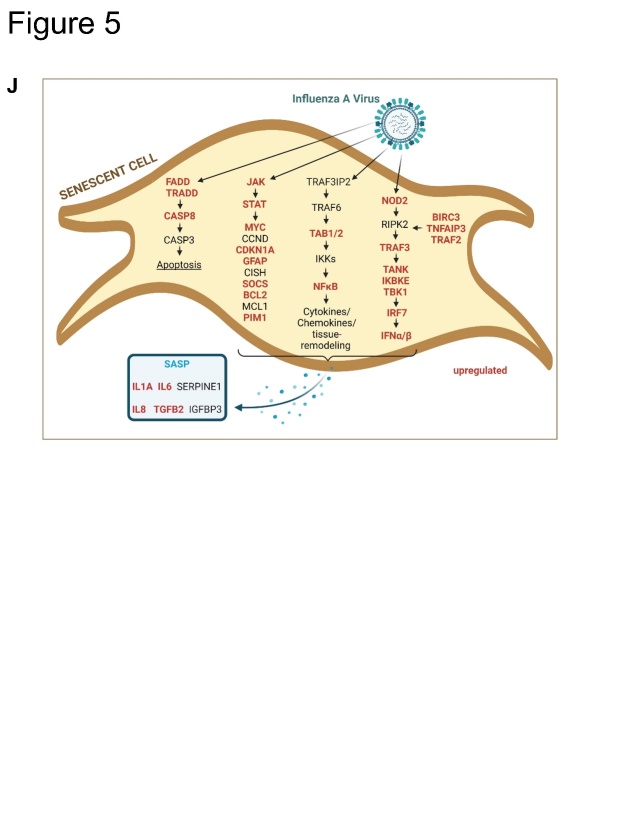
Influenza virus load is enhanced in senescent human lung fibroblasts. (A) Schematic representation of infection with IAV (MOI 1) of senescent IMR-90s (IAVTNF-α) for 8 h and 24 h. (B) qRT-PCR analysis of IL-6, IL-8, and IP-10 of quiescent mock- (MOCKQUI) and IAV-infected (IAVQUI), as well as uninfected senescent cells (MOCKTNF-α) and IAVTNF-α, was performed (N = 3). Significance was calculated with One-way ANOVA (ns p > 0.05; * p ≤ 0.05). (C) Protein levels of IL-1β, IL-6, IL-8, IFN-γ, and TNF-α were increased in IAVTNF-α after 24 h (N = 3). Significance was calculated with One-way ANOVA (ns p > 0.05; * p ≤ 0.05). (D) Viral titer detected by standard plaque assay was increased in IAVTNF-α compared with IAVQUI after 24 h (N = 3). Significance was calculated with One-way ANOVA (ns p > 0.05; * p ≤ 0.05). (E) Immunofluorescence staining of IAVTNF-α and IAVQUI for IAV nucleoprotein, phalloidin, and DAPI showed higher signals for IAVTNF-α. Scale bar 50 µm. (F) Transcriptomic analysis of senescent (IAVTNF-α) and quiescent IMR-90s (IAVQUI) after IAV infection. Overall, in the Venn diagram, the IAVTNF-α group shares 144 RNAs with the IAVQUI group. 113 RNAs are individually expressed in IAVTNF-α in comparison to 195 individually expressed RNAs in the IAVQUI. (G) Different signalling pathways are illustrated in the GO enrichment analysis of IAVTNF-α and IAVQUI. The IAVTNF-α group has significant changes regarding cell motility, extracellular matrix, and signalling receptor activity. (H, I) Individually expressed genes are demonstrated in heatmaps. The genes JAK3, SOCS3, SOCS1, TNFAIP3, and CXCL6, are differentially expressed in IAVTNF-α compared to IAVQUI. Gene expression in heatmaps over log2 fold-change. (J) Schematic representation of the influence of an IAV infection on senescent cells and the SASP.


