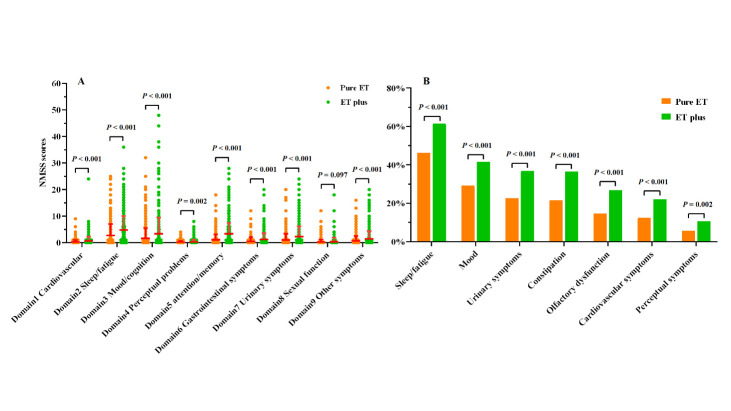
Figure 5.
Comparison of non-motor features between pure ET and ET plus. (A) The NMSS sub-scores in the ET plus group were higher than those in the pure ET group (mean ± SD). (B) The frequency of non-motor symptoms presented in the ET plus group were higher than in the pure ET group. NMSS, Non-Motor Symptoms Scale.

