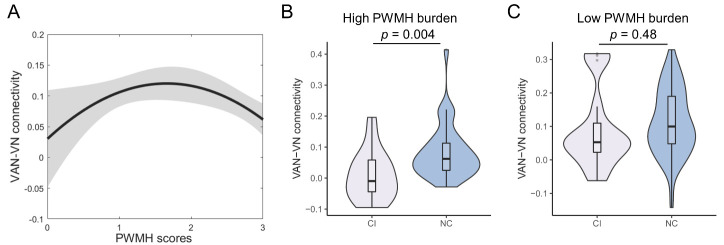
Figure 7.
Association between PWMH scores and VAN-VN connectivity and group comparison in high WMH burden group. (A) Inverted U-shaped relation of periventricular white matter hyperintensity (PWMH) scores and ventral attention network (VAN)-visual network (VN) connectivity (linear model, β = -0.147, p = 0.08; quadratic model, β1 = 1.021, p = 0.03, β2 = -1.187, p = 0.01) (PWMH = 0, n = 4; PWMH = 1, n = 53; PWMH = 2, n = 28; PWMH = 3, n = 54). Grey fill indicates 95%CI. (B) Violin plot of VAN-VN connectivity in cognitive-impairment (CI, n = 17, M = 0.008 (SE = 0.019)) and normal-cognition (NC, n = 37, M = 0.083 (SE = 0.014)) groups in high PWMH burden subgroup. (C) Violin plot of VAN-VN connectivity in CI (n = 16, M = 0.091 (SE = 0.030)) and NC (n = 69, M = 0.111 (SE = 0.012)) groups in low PWMH burden subgroup. Violins show the data distribution. Boxes represent the interquartile range, vertical lines show the maximum and minimum values, and horizontal lines indicate the median.

