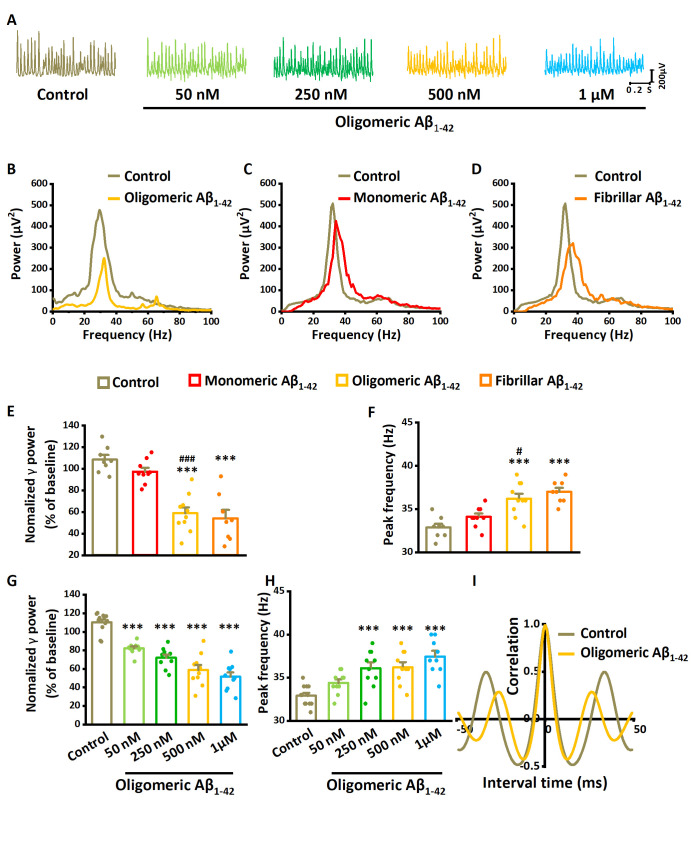
Figure 2.
The effect of Aβ1-42 on γ-oscillations. (A) Example of oscillatory activity recorded in stratum pyramidale of CA3 before (brown trace) and 60 minutes after perfusion with 500 nM oligomeric Aβ1-42 (yellow trace). (B) Power spectra were taken from the recordings in (A), five minutes before application (baseline control: brown line) and 55-60 minutes after oligomeric Aβ1-42 application (yellow line). (C) Example of the power spectrum before (brown) and after 500 nM monomeric Aβ1-42 application (red line). (D) Example of the power spectrum before (brown) and after 500 nM fibrillar Aβ1-42 application (orange line). (E) γ-oscillation power as % of baseline control (100 nM kainate for 120 minutes), 500 nM monomeric Aβ1-42, 500 nM oligomeric Aβ1-42 and 500 nM fibrillar Aβ1-42. n= 8 for time-only control, n= 9 for monomeric Aβ1-42, n= 10 for oligomeric Aβ1-42, n= 8 for fibrillar Aβ1-42. Significant differences with time-only control are indicated with **, P< 0.01, ***, P< 0.001. Differences between preparations are indicated with ###, P< 0.001 analyzed by unpaired t-test. (F) γ-oscillation peak frequency for the same groups, Details as in (E). (G) γ-oscillation power as % of baseline control for increasing concentrations of oligomeric Aβ1-42 and control. n=12 for time-only control, n=10 for 50 nM oligomeric Aβ1-42, n=10 for 250 nM oligomeric Aβ1-42, n=10 for 500 nM oligomeric Aβ1-42, n= 9 for 1μM oligomeric Aβ1-42. Data are presented as mean ± SEM. ***, P< 0.001, compared with time-only control, one-way ANOVA with Tukey’s post hoc test. (H) γ-oscillation peak frequency for control and increasing concentrations of oligomeric Aβ1-42. Details as in (G). (I) Auto-correlogram of the recording in A shows a 500 nM oligomeric Aβ1-42-induced reduction in oscillation regularity.

