Figure 7.
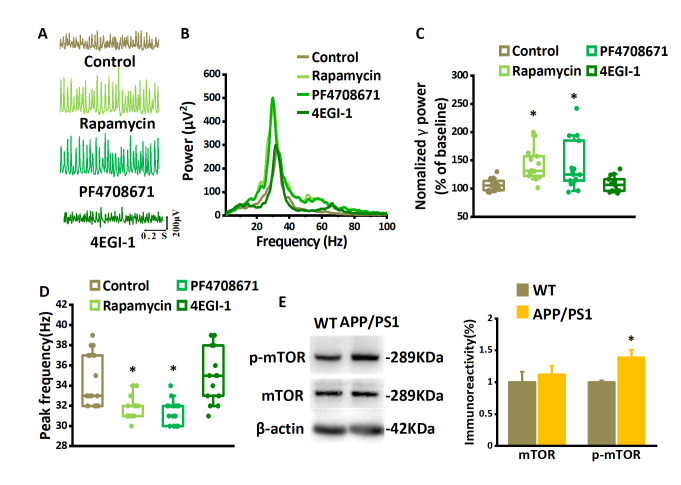
The suppression of γ-oscillations in APP/PS1 mice depends on mTOR/S6K1 pathway hyper-activation. Example of traces. (A) and power spectra (B) of γ-oscillations recorded in slices from APP/PS1 mouse without and with the application of rapamycin, PF4708671, or 4EGI-1. (C) γ-oscillation power in APP/PS1 mice as % of baseline control, rapamycin, PF4708671 or 4EGI-1. n=15 for control, n=14 for rapamycin, n=15 for PF4708671 and n=14 for 4EGI-1. (D) γ-oscillation peak frequency in APP/PS1 mice in control and after rapamycin, PF4708671, or 4EGI-1. Details as in (C). Data are presented as median±min-max, *, P< 0.05, analyzed by Mann-Whitney U test. (E) Representative Western blot quantification of mTOR and the serine 2448 phosphorylated mTOR (p-mTOR). Relative protein level was calculated by normalizing phosphorylated form levels to their corresponding total protein levels and total protein levels to the β-actin levels, respectively. Data are presented as mean ± SEM. *, P< 0.05, compared with WT, t-test, n=12 mice for each group.

