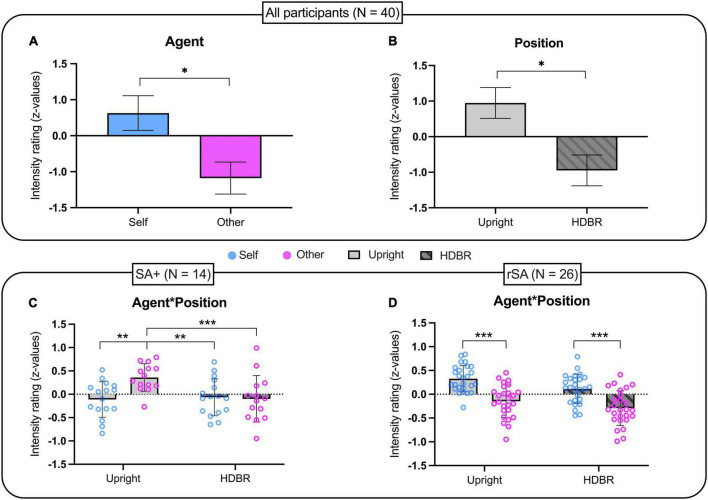
FIGURE 2.
Intensity rating of somatosensory stimulations in: (A,B) the whole group (n = 40); (C) the sub-group of participants showing sensory attenuation in upright position (n = 14); (D) the sub-group of participants showing reversed sensory attenuation in upright position (n = 26). Data have been transformed into z-scores and presented as mean and standard error of the mean (SEM). *p < 0.05, **p < 0.01, ***p ≤ 0.001.

