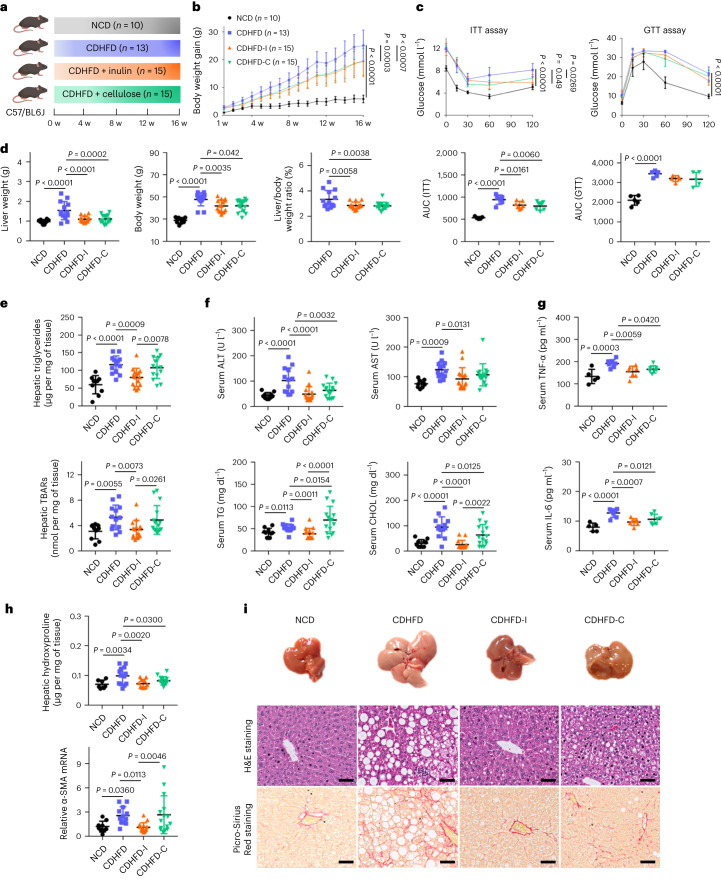
Fig. 1. Inulin ameliorated CDHFD-induced NASH in mice.
a, Study design of the CDHFD-induced NASH model. Created with BioRender.com. b, Body weight curve under different treatments. Data are presented as the mean of biological replicates ± s.d. P value obtained by two-way ANOVA with Fisher’s LSD test. c, Insulin tolerance and glucose tolerance tests. Between five and seven mice were used in each group in the insulin tolerance test (ITT): NCD (n = 5), CDHFD (n = 6), CDHFD-I (n = 7) and CDHFD-C (n = 7). Five mice were used in each group in the glucose tolerance test (GTT). Data are presented as the mean of biological replicates ± s.d. P value obtained by two-way ANOVA with Fisher’s LSD test for the growth curve, or one-way ANOVA with Fisher’s LSD test for area under the curve. d, Liver weight, body weight and liver-to-body weight ratio. e, Hepatic TG and TBARs. f, Serum ALT, AST, TG and CHOL. d–f, Between 10 and 15 mice were used in each group: NCD (n = 10), CDHFD (n = 13), CDHFD-I (n = 15) and CDHFD-C (n = 15). g, Serum TNF-α and IL-6. Between five and seven mice were used in each group: NCD (n = 5), CDHFD (n = 7), CDHFD-I (n = 7) and CDHFD-C (n = 7). h, Hepatic hydroxyproline and α-SMA mRNA. Between 7 and 15 mice were used in each group for the hepatic hydroxyproline assay: NCD (n = 7), CDHFD (n = 13), CDHFD-I (n = 11) and CDHFD-C (n = 15). Between 9 and 15 mice were used in each group for α-SMA mRNA expression: NCD (n = 9), CDHFD (n = 12), CDHFD-I (n = 15) and CDHFD-C (n = 15). i, Representative morphology, haematoxylin and eosin (H&E) staining, and Picro-Sirius Red staining of the liver from mice fed NCD, CDHFD, CDHFD-I and CDHFD-C. Scale bar, 50 µm. One slide per mouse was stained. d–h, Data are presented as the mean of biological replicates ± s.d. P value obtained by one-way ANOVA with Fisher’s LSD method.

