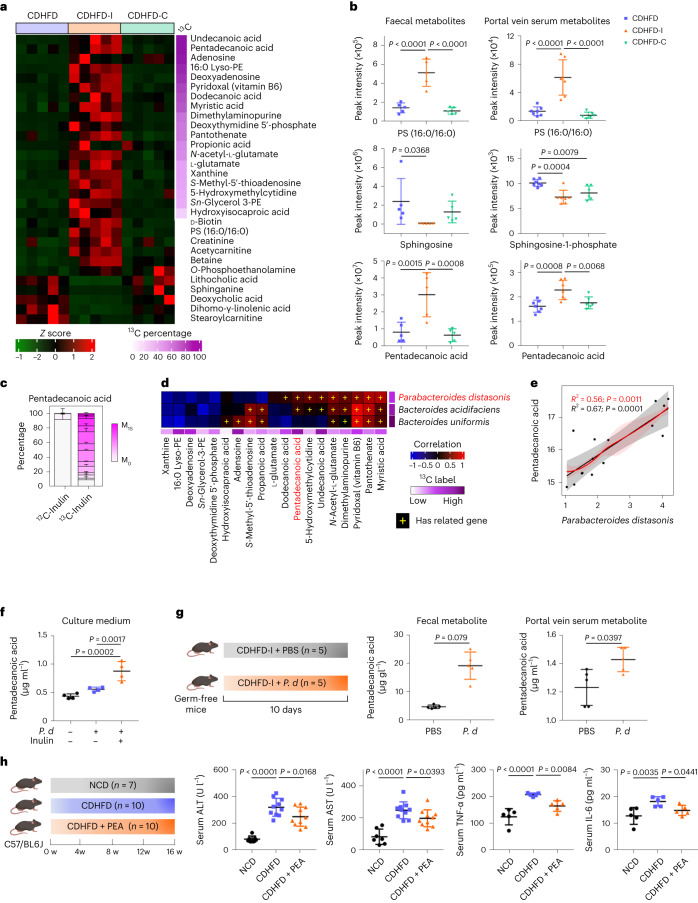
Fig. 4. Inulin modulated gut metabolites.
a, Heatmap of representative faecal metabolites in mice fed CDHFD, CDHFD-I and CDHFD-C. The right-hand side represents the percentage of 13C-labelling for each metabolite. Lyso-PE, lysophosphatidylethanolamine; PS, phosphatidylserine; sn-glycerol 3-PE, sn-glycerol 3-phosphoethanolamine. b, Quantification of representative metabolites in faecal (n = 5 per group) and portal vein serum (n = 6–7 per group). c, Isotopologue distribution of labelled pentadecanoic acid in stool from mice treated with CDHFD-I (n = 3), data are presented as the mean of biological replicates ± s.e.m. d, Correlation analysis between 13C-labelled bacteria and metabolites by partial Spearman’s correlation. Plus signs indicate that the bacteria expressed genes necessary for the biosynthesis of the respective metabolites. e, Correlation between P. distasonis and pentadecanoic acid abundance with (red) and without (grey) correction. Error bands indicate the 95% confidence interval. f, Targeted metabolomic analysis of pentadecanoic acid in blank medium or P. distasonis conditioned medium with or without the addition of inulin, n = 4 per group. g, Experimental design of P. distasonis (P. d) gavage in germ-free mice fed with CDHFD-I. Created with BioRender.com. Pentadecanoic acid was detected in faeces and portal vein serum, n = 5 per group. h, Effect of pentadecanoic acid (0.4%) on CDHFD diet-induced liver damage. Created with BioRender.com. Between 7 and 10 mice were used in the serum ALT and AST tests: NCD (n = 7), CDHFD (n = 10), and CDHFD + pentadecanoic acid (PEA) (n = 10). Five mice from each group were used for serum TNF-α and IL-6 tests. b, f–h, Data are presented as biological replicates ± s.d. P value obtained by one-way ANOVA with Fisher’s LSD.

