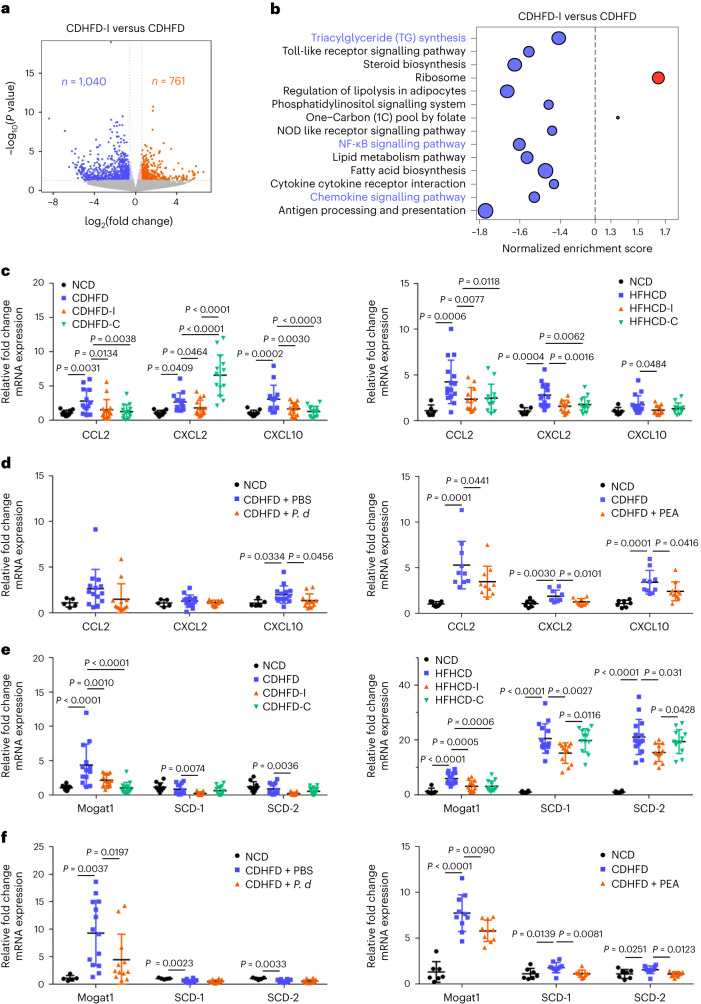
Fig. 6. Inulin suppressed hepatic inflammation and TG synthesis pathways through enriching P. distasonis and pentadecanoic acid.
RNA-seq analysis of liver tissues from mice fed CDHFD or CDHFD-I. a, Volcano plot showing differentially expressed genes. b, Kyoto Encyclopedia of Genes and Genomes pathway enrichment. Five mice were used in each group. P value determined by DESeq2. c,d, qPCR validation of pro-inflammatory cytokines in the liver tissues from mouse NASH models treated with inulin (c), cellulose (c), P. distasonis (P. d) (d) or PEA (d). e,f, qPCR validation of triacylglyceride synthesis genes in the liver tissues in mouse NASH models supplemented with inulin (e), cellulose (e), P. d (f) or PEA (f). c,e, Between 10 and 15 mice were used for CDHFD-induced NASH models: NCD (n = 10), CDHFD (n = 13), CDHFD-I (n = 15) and CDHFD-C (n = 14). Between 6 and 15 mice were used for HFHCD-induced NASH models: NCD (n = 6), HFHCD (n = 15), HFHCD-I (n = 12) and HFHCD-C (n = 12). d,f, Between 5 and 14 mice were used for the CDHFD treated with P. d experiments: NCD (n = 5), CDHFD + PBS (n = 14) and CDHFD + P. d (n = 12). Between 7 and 10 mice were used for the CDHFD treated with PEA experiments: NCD (n = 5), CDHFD (n = 10) and CDHFD + PEA (n = 10). c–f, Data are presented as means of biological replicates ± s.d. P value obtained by one-way ANOVA with Fisher’s LSD.

