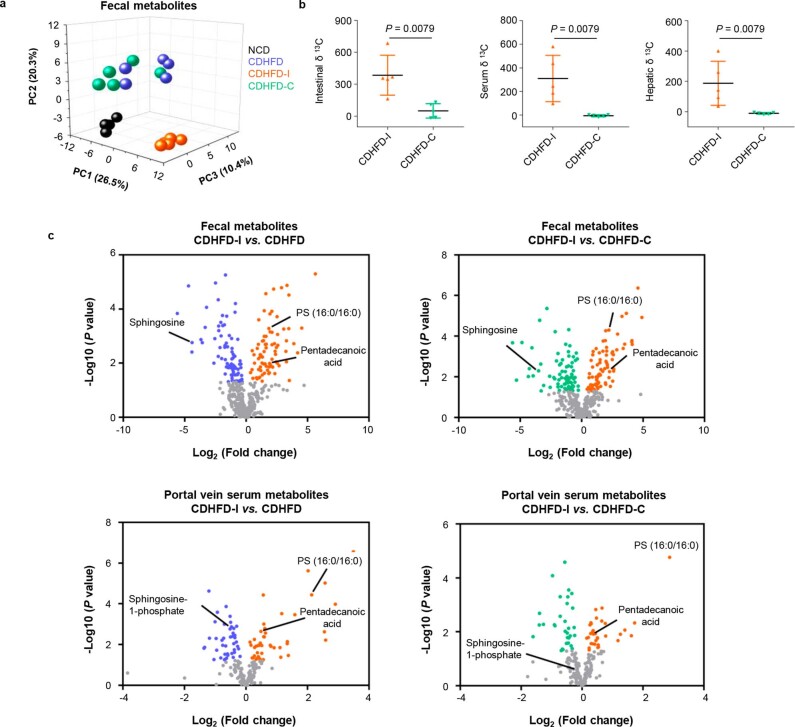
Extended Data Fig. 3. Inulin altered gut metabolomics.
a Principal component analysis (PCA) of faecal metabolites from mice fed NCD, CDHFD, CDHFD-I, and CDHFD-C, respectively.5 mice were included in each group. b δ13C value in the intestinal tissue, serum and liver tissue of mice received 13C-inulin or 13C-cellulose (n = 5 per group) for 36 h. Data are presented as mean of biological replicates ± s.d. Statistical significance was determined by two tailed Mann-Whitney U test. c Volcano plots showing altered faecal or portal vein serum metabolites in CDHFD-I group compared to CDHFD group or CDHFD-C group. 5–7 mice were used in each group. P value was obtained by two tailed students’ t test.

