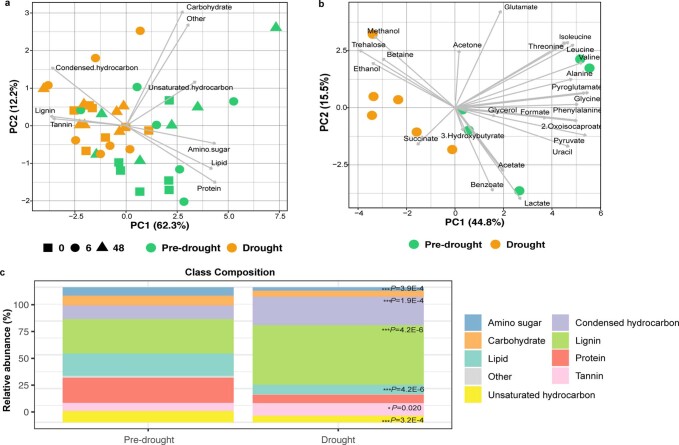
Extended Data Fig. 7. Drought induced a shift in both primary and secondary metabolic composition.
a) PCA biplot of samples collected during pre-drought (green; 0 h [n = 5]) or drought (orange; 0 h [n = 5] and 6 h [n = 1]) showing relationships between metabolic profiles identified with NMR which were mostly identified as primary metabolites with relatively low molecular weight. Arrows represent the loadings of individual metabolites. b) PCA biplot of samples collected during pre-drought (green) or drought (orange) showing relationships between profiles of metabolic classes identified with FTICR-MS, capturing mostly high molecular weight metabolites including secondary metabolites. Arrows represent the loadings of metabolic classes driving these patterns. P-values indicate significance of clustering between pre-drought and drought conditions using PERMANOVA on bray-curtis dissimilarity matrix. c) Each stacked bar represents the composition of compound classes identified with FTICR-MS for all samples (n = 18 [6 chambers sampled at 0, 6, and 48 h post pyruvate addition] averaged across pre-drought and drought conditions). Exact P-values are shown as determined by Linear Mixed Effects Models; *, P < 0.05; **, P < 0.01; ***, P < 0.001.

