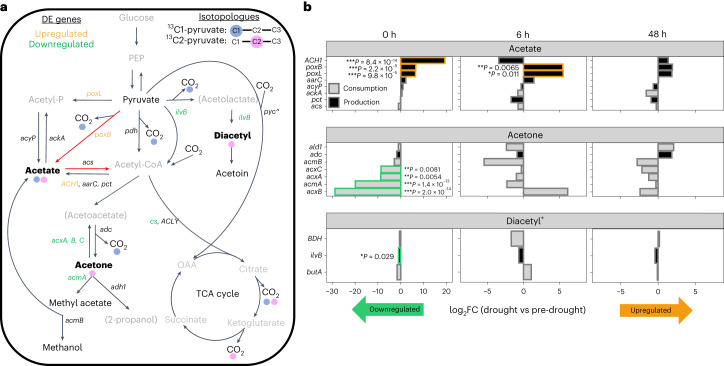
Fig. 3. Expression of genes encoding enzymes that cycle 13C-enriched VOCs shifts with drought.
a, Pyruvate metabolism pathways that lead to 13C-enriched VOCs and CO2, shown with blue and pink circles, to represent incorporation of 13C-pyruvate from the C1 and/or C2 position, respectively. Colour code for compound names: grey names without brackets indicate compounds that were not measured, grey names with brackets indicate VOCs that were not emitted, plain black names indicate VOC fluxes that were emitted but not 13C-enriched and bold black names indicate VOC emissions that were 13C-enriched (acetate, acetone, diacetyl+). Red arrows represent a potential PDH bypass route of acetyl-CoA production from pyruvate to acetate to acetyl-CoA. Green and orange gene names signify down- or upregulation during drought, respectively, compared to pre-drought conditions. b, Changes in gene expression across all sites (for pre-drought: 0 and 48 h (n = 6), 6 h (n = 5); for drought: n = 6 for each timepoint) as log2 fold-change (log2FC) of drought vs pre-drought for acetate, acetone and diacetyl+ (C4H6O2) at 0, 6 and 48 h post pyruvate addition. Genes that encode enzymes involved in production are in black bars and consumption in grey bars. P values in b are based on DESeq2 and are FDR corrected. ^, anaplerotic CO2 assimilation via pyc (pyruvate carboxylase) leading to some 13C from 13C1-pyruvate entering the TCA cycle and being released as 13C-CO2. acxA–C, acetone carboxylase subunits A–C; ilvB, acetolactate synthase; cs, citrate synthase; ald1, NAD+-dependent secondary alcohol dehydrogenase; OAA, oxaloacetate; PEP, phosphoenolpyruvate. *P < 0.05, **P < 0.01, ***P < 0.001.

